
2024 WR Rookie Super Model: Tiers 1 & 2 - the Best Wide Receivers in the NFL Draft
Dwain McFarland identifies the top rookie wide receiver prospects that he classifies in Tiers 1 and 2 in the 2024 NFL Draft based on data points that correlate most with future NFL production.
With the NFL Draft quickly approaching, we are releasing our updated Fantasy Life Rookie Super Model.
Our goal is to identify the top rookie prospects based on data points that correlate most with future NFL production. I have been working on NFL rookie models for the last three years, and over that time, I have studied and measured hundreds of predraft variables against future NFL production.
This is a great time to clarify that I am not a mathematician or a coder. Yes, I have a background in data and analytics, but I am self-taught. I didn’t take a course or go to a university to study these topics. I simply love data, understanding why things work the way they do and football.
OK, back to the point I made before the disclaimer.
The truth is that most variables don’t carry a strong signal, or they overlap too much with an existing variable to make it into a model. Even once you define a list of relatively strong inputs, it is hard to accurately predict which college athletes will be the best NFL players.
Football is a sport with countless dependencies played by notoriously unpredictable creatures known as human beings. When you add in plain old variance, you can see how this activity can become challenging. But that is what makes it so interesting, and it fuels me to test new ideas every offseason.
So, without further ado. Let’s dive into the inputs used for the 2024 WR Super Model, and then dive into Tiers 1 and 2 of the 2024 Rookie WR Super Model.
For the rest of the WR Super Model tiers, see below:
- Tiers 1-2
- Rome Odunze | Washington
- Malik Nabers | LSU
- Marvin Harrison Jr. | Ohio State
- Tier 3
- Brian Thomas Jr. | LSU
- Xavier Worthy | Texas
- Troy Franklin | Oregon
- Tier 4
- Ladd McConkey | Georgia
- Adonai Mitchell | Texas
- Keon Coleman | Florida State
- Jermaine Burton | Alabama
- Roman Wilson | Michigan
- Tier 5
- Ricky Pearsall | Florida
- Ja'Lynn Polk | Washington
- Malachi Corley | Western Kentucky
- Jacob Cowing | Arizona
- Devontez Walker | North Carolina
- Jalen McMillan | Washington
- Xavier Legette | South Carolina
WR Super Model Overview
The inputs are in order of their correlation to fantasy production in a WR’s first two years in the NFL.
- Projected draft capital (NFL Mock Draft Database)
- Collegiate program quality
- Adjusted career receiving yards per team pass attempt
- Career targeted QB rating
- Career TDs per game
- Age
Because the model includes advanced data that isn’t widely available before the 2018 class, our sample focuses on WRs with at least two years of play since then. So, our correlations to future performance currently derive from WR data from 2018 to 2022.
For all production stats, the data comes from the game log level rather than the season.
If you want all the details and reasoning behind the inputs and methodology, they are outlined in the WR Super Model Inputs & Methodology at the bottom of this page.
Tier 1 – Superstar Traits With High-End WR1 Upside
Marvin Harrison Jr. | Ohio State
- WR Super Model: 100th percentile
- Age: 22.1
- Height: 6-foot-3
- Weight: 209
- Marvin Harrison Jr. Scouting Report via Ian Hartitz
Pedigree
- Program Quality Index: 84th percentile
- NFL Mock Drafts: Pick 4, Round 1
- 247 Recruit Player Rating: 4 of 5 stars
Harrison is arguably the most well-known WR prospect of the last decade. He is the son of an NFL Hall of Famer and was in the national spotlight almost every Saturday, playing at Ohio State.
The Buckeyes Rank No. 2 in the Program Quality Index for WRs. Based on data from 2014 to 2023, they rank in the 84th percentile, primarily thanks to three first-round picks: Garrett Wilson, Chris Olave and Jaxon Smith-Njigba. That ties for second-most with USC and TCU behind Alabama (7).
No other metric I tested correlated more strongly with NFL Draft Capital than the Program Quality Index. So, it isn’t surprising that Harrison carries high first-round expectations. If the former four-star recruit goes to the Cardinals at pick 4, it would be the highest we have seen a WR go since Ja’Marr Chase went No. 5 in 2021.
Production
- Adjusted Career RYPTPA Index: 70th percentile
- Career Total TDs Per Game Index: 81st percentile
- Career Targeted QB Rating Index: 77th percentile
Harrison played in 12 games as a true freshman, but his route participation was limited to 28%, with Wilson, Olave and Smith-Njigba providing stiff competition. However, at 20, he stepped into a full-time role in his sophomore campaign, and the production followed.
That year, he broke out with a whopping 30% target share — the highest mark from any Buckeye since 2014 — and registered an elite 3.08 receiving yards per team pass attempt (RYPTPA). In his age-21 season, Harrison topped those tallies with a 31% target share and 3.18 RYPTPA.
He was an absolute target monster against man coverage with 39% targets per route run (TPRR), the highest career mark we have from any Ohio State receiver in the database. Most top-tier performers dominate against man coverage at the NFL level, which bodes well for Harrison.
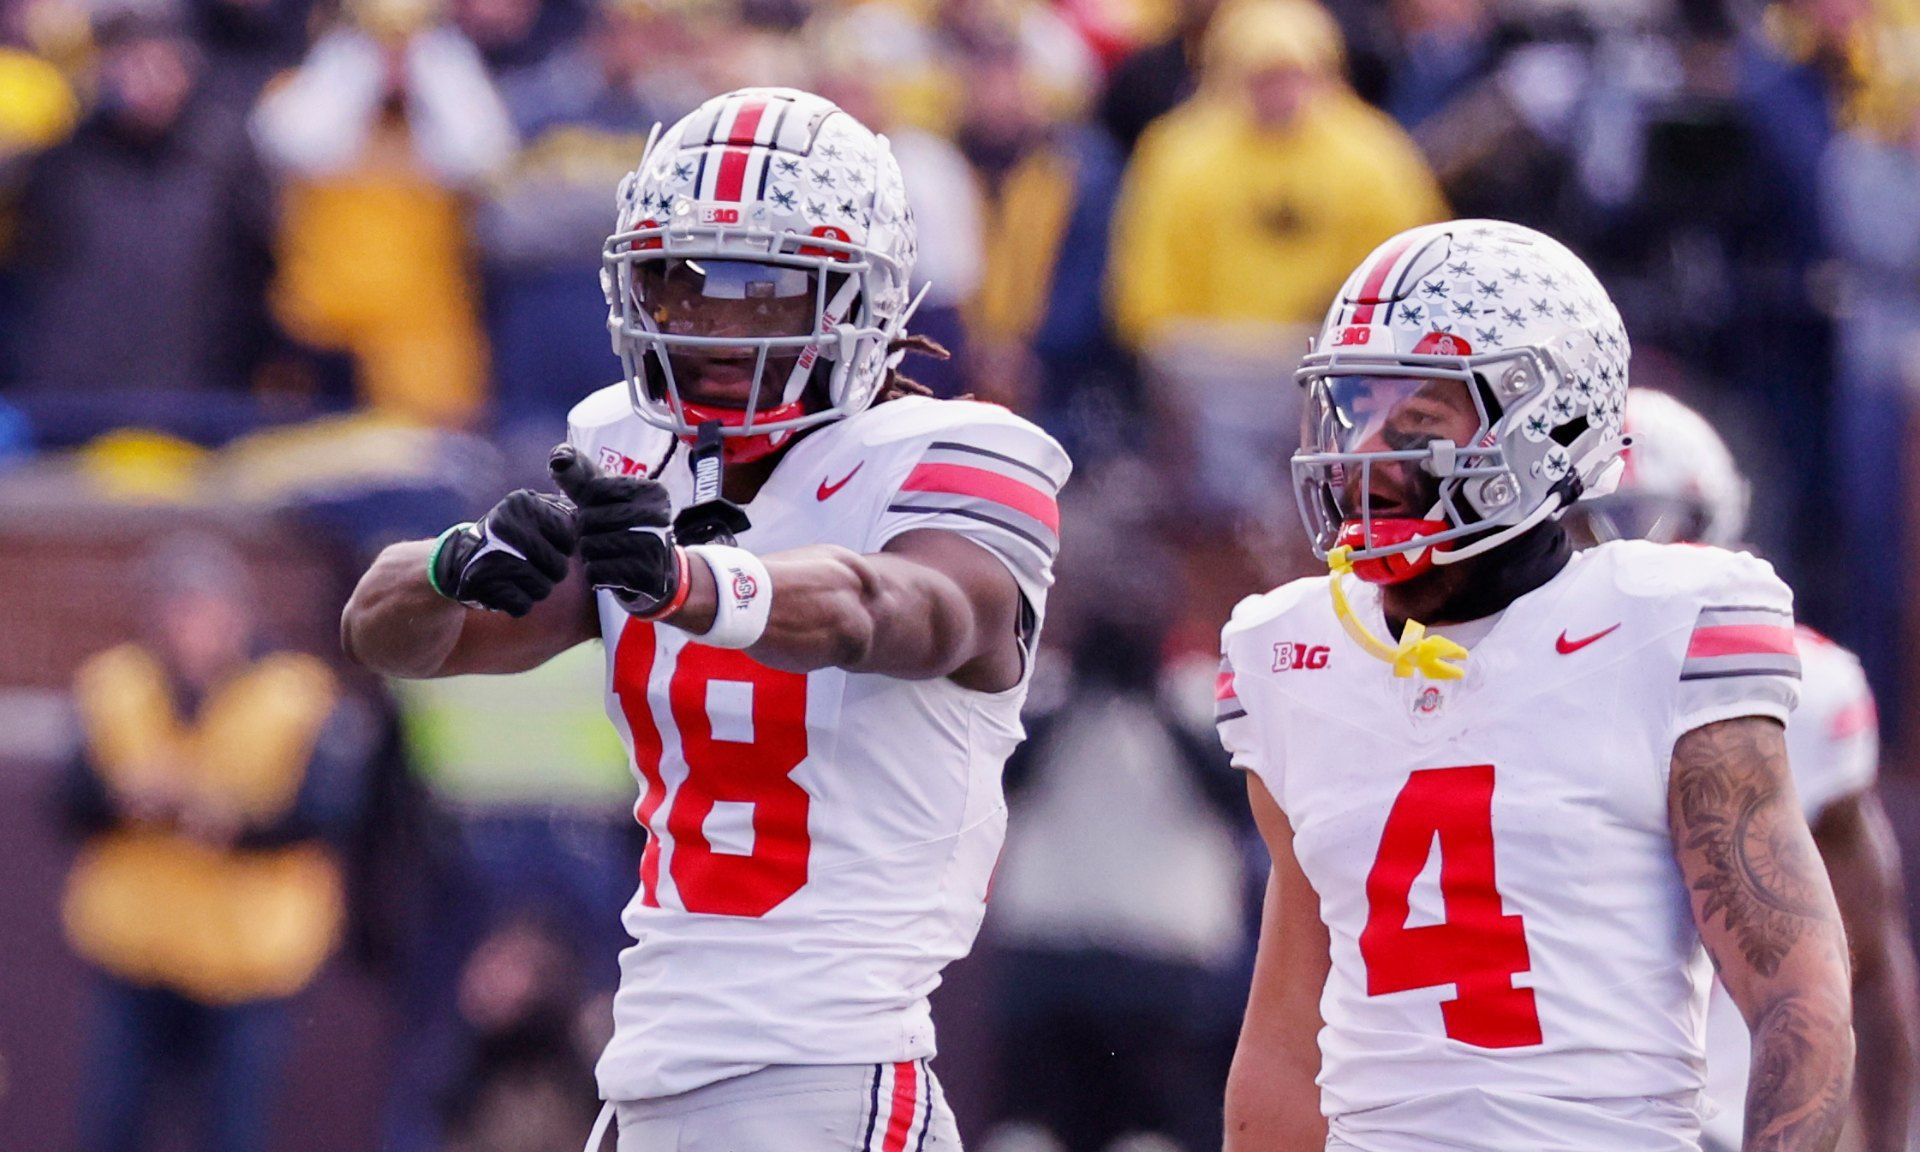
Nov 25, 2023; Ann Arbor, Michigan, USA; Ohio State Buckeyes wide receiver Marvin Harrison Jr. (18) celebrates a first down in the first half against the Michigan Wolverines at Michigan Stadium. Mandatory Credit: Rick Osentoski-USA TODAY Sports
Against zone coverage, targets often spread out, which was also the case for the Buckeyes, but Harrison’s 25% TPRR was 5% above average for a collegiate WR with at least 250 routes in their career. That mark was also better than JSN and Wilson’s career marks, and Harrison rarely saw the benefit of slot play, with 84% of his snaps coming out wide.
Harrison wasn’t great after the catch, averaging -0.2 yards per reception below expectation. In his Rookie Scouting Portfolio, Matt Waldman notes that the film wasn’t strong in this area.
“Harrison isn’t an especially powerful runner for his size nor is he a dynamic mover. He doesn’t make multiple defenders miss and he lacks lateral cuts with a significant range of motion. He can bend away from pursuit and he builds up speed, but he’s not a sudden stop-start accelerator in tight spaces like Nabers or Odunze.”
It seems Ohio State knew this. Only 8% of his targets came behind the line of scrimmage, which was 4% below the NCAA average at WR. While this could be a limitation for Harrison in the NFL, he consistently found access to the field's intermediate (10 to 19 yards) and deep (20-plus yards) areas, where he garnered 37% and 22% of his targets. Those marks were 10 and 2 percentage points above the NCAA average for WRs.
Marvin Harrison Jr. Fantasy Outlook: Hit Rates and Historical Comps
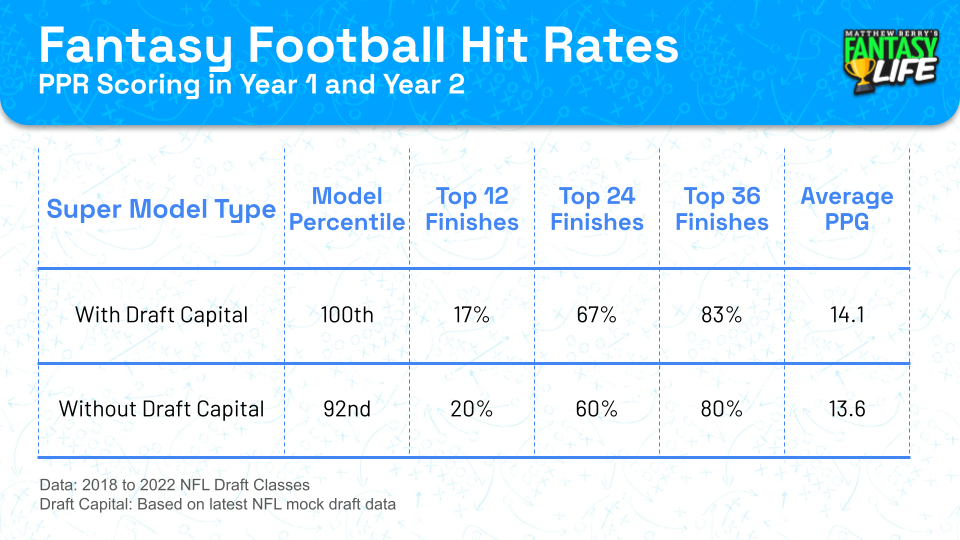
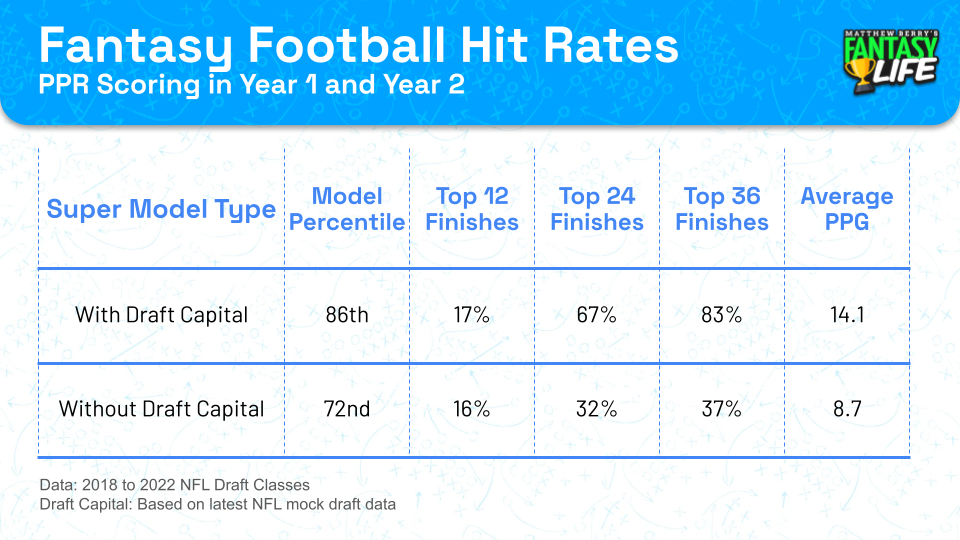
Harrison has the highest score in the history of the WR Super Model if we include his expected NFL Draft capital. He will surpass Chase’s old high score if he goes fourth overall. However, even without draft capital (92nd percentile), the model loves Maserati Marv, holding the sixth-highest finish since 2018.
While the sample size is small, the results for players in his range have been excellent in the first two years of their careers. Over half of them have achieved top-24 status by reaching at least 13.7 points per game.
Using Harrison’s score in the model and accounting for aDOT, we can fashion a comp group to get a feel for his range of outcomes. The ceiling is high, but there are some cautionary tales as well.
- Ceiling: Ja’Marr Chase
- Floor: Rashod Bateman
Chase has been a major boon for fantasy managers, but Bateman doesn’t have a top-36 finish. Harrison comes from a much stronger program. However, Bateman was a high-end RYPTPA performer who attacked the intermediate areas (13.8 aDOT) but wasn’t elite with the ball in his hands (1.1 YAC over expected).
While these hit rates are strong, and the ceiling comp makes us starry-eyed, Harrison carries some risk — especially in non-dynasty formats this year. He is currently the WR10 overall with a Round 2 price tag, which doesn’t leave much room for error. Even if Harrison is a GREAT player, immediately expecting a top-12 finish is aggressive, despite Chase and Justin Jefferson recently achieving this accomplishment.
Ultimately, I want exposure to Harrison regardless of the price because of his profile, BUT I would prefer gaining access to him in non-dynasty formats slightly below ADP.
Malik Nabers | LSU
- WR Super Model: 95th percentile
- Age: 21.1
- Height: 6-foot
- Weight: 200
Pedigree
- Program Quality Index: 80th percentile
- NFL Mock Drafts: Pick 5, Round 1
- 247 Recruit Player Rating: 4 of 5 stars
Nabers doesn’t come with the same pent-up anticipation as Harrison, but he is gaining steam as we get closer to the draft. Some NFL Draft and fantasy analysts have even moved Nabers to the WR1 position in their rankings. While some prospect fatigue is occurring with Harrison, Nabers’ profile has merit.
Like Harrison, Nabers comes from one of the world's most lauded WR factories. Something must be in the water down in Baton Rouge because LSU has manufactured some of the best WRs of the last decade. Odell Beckham Jr., Ja’Marr Chase and Justin Jefferson ALL delivered WR1 performances as rookies.
Nabers is projected to go one pick after Harrison in the NFL Draft and was ranked two spots ahead of Harrison as the No. 19 high-school WR prospect in 2021. These two players are closer than many want to believe, and that doesn’t stop at pedigree — Nabers was a highly productive player at LSU.
Production
- Adjusted Career RYPTPA Index: 76th percentile
- Career Total TDs Per Game Index: 51st percentile
- Career Targeted QB Rating Index: 71st percentile
Adjusted career RYPTPA accounts for age, aDOT, alignment, QB play and quality of teammates (target competition). It is the most robust production measurement we have in our database, and no other production metric carries as much signal for future fantasy points.
Who ranked No. 1 in the 2024 class?
Yep. Malik Nabers.
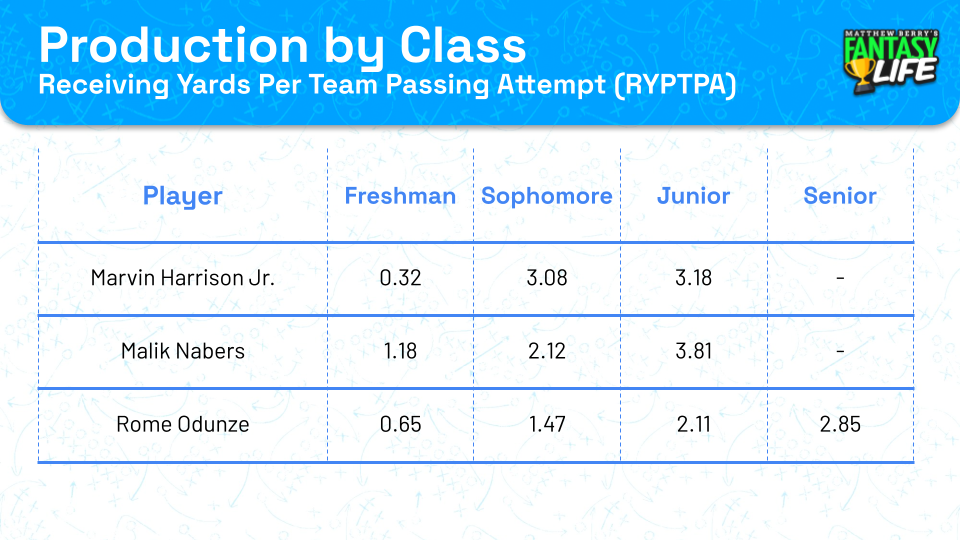
The 21-year-old WR carved out a 52% route participation as an 18-year-old freshman, and while he didn’t post jaw-dropping RYPTPA (1.18), he made a substantial impact on a per-route basis. His 1.95 yards per route run (YPRR) was 0.40 above expectation for his age. As a sophomore, Nabers upped his RYPTPA to 2.12 and then erupted as a junior, posting a mark of 3.81.
The biggest reason Nabers comes in behind Harrison in the model is his Total TDs per Game Index (51st percentile). While TDs can be fluky, at a career level, they carry signal in the model. He came in at a level similar to Jaylen Waddle and Drake London but below names like Chase, Garrett Wilson and CeeDee Lamb.
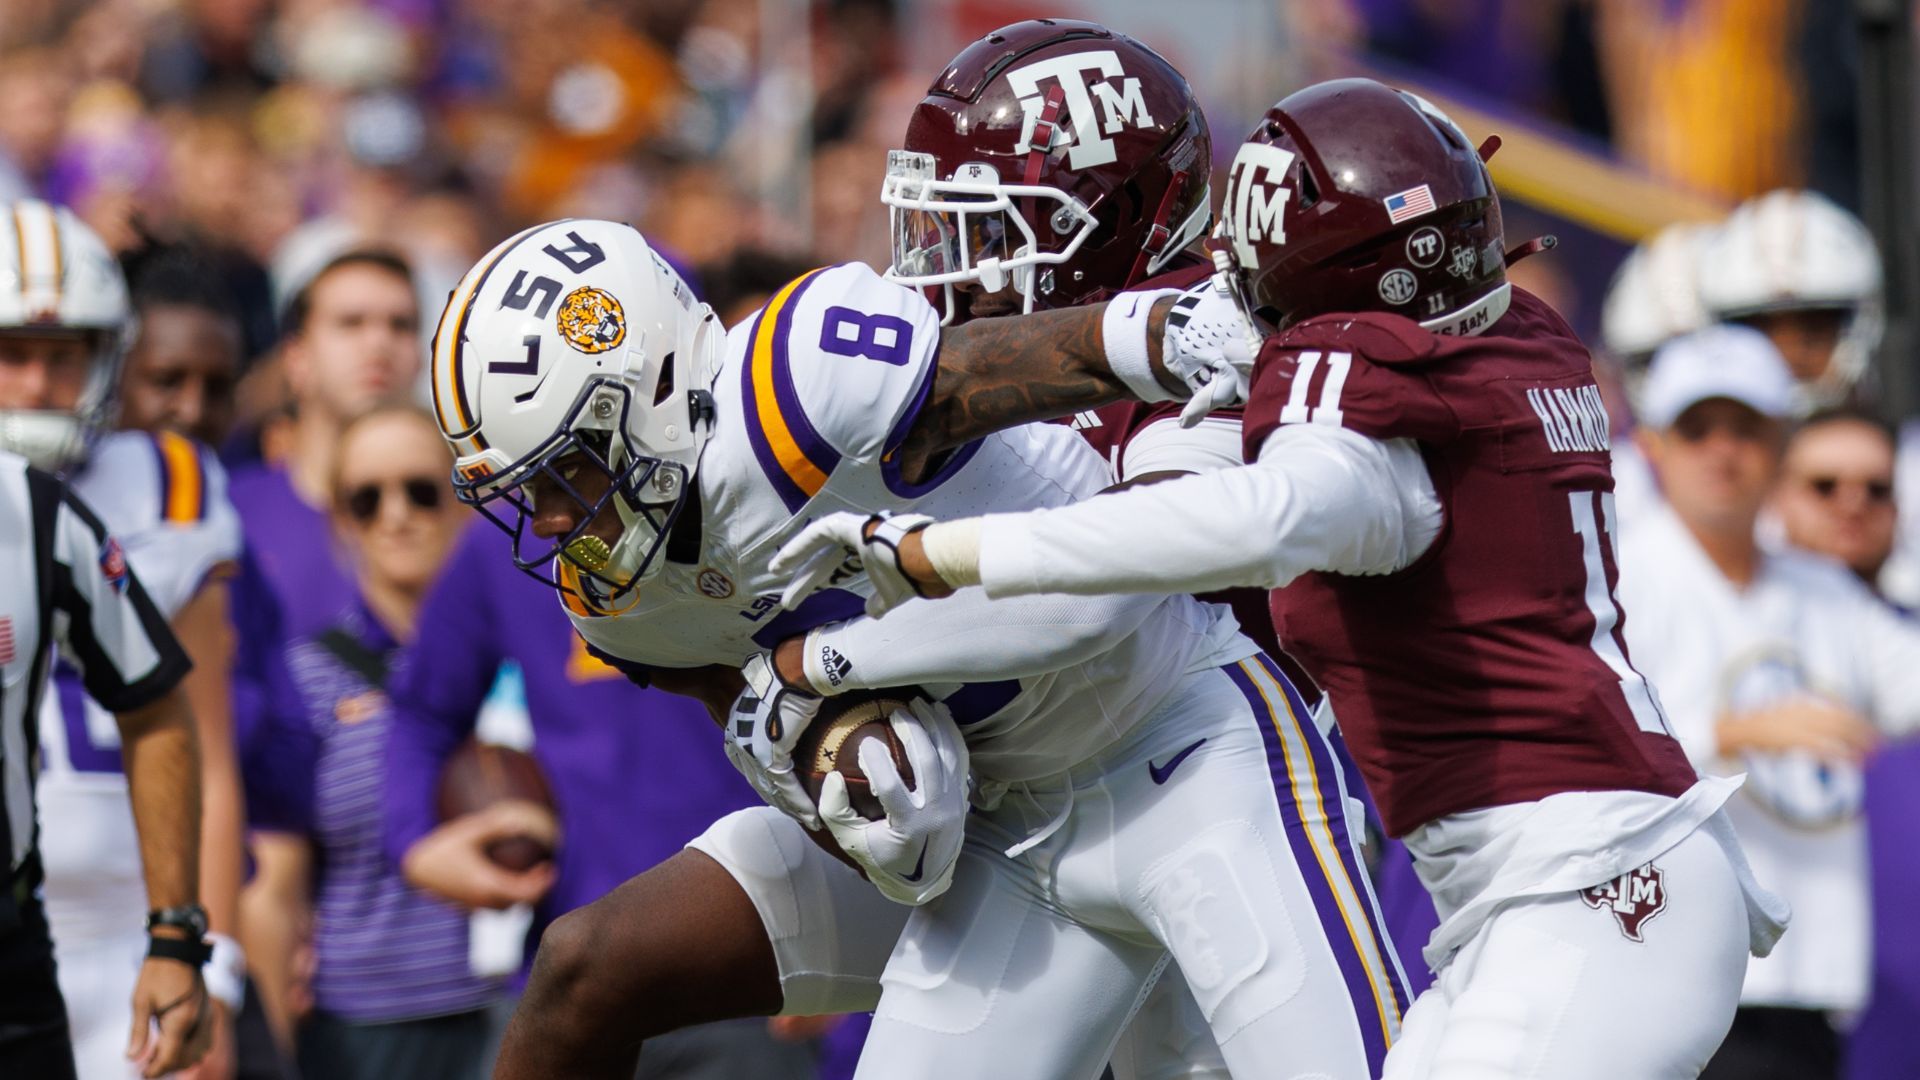
Nov 25, 2023; Baton Rouge, Louisiana, USA; LSU Tigers wide receiver Malik Nabers (8) runs against Texas A&M Aggies defensive back Jacoby Mathews (2) during the second half at Tiger Stadium. Mandatory Credit: Stephen Lew-USA TODAY Sports
Nabers wasn’t quite as dominant against man coverage as Harrison, but his 30% TPRR was well above the NCAA average of 22% for WRs with at least 250 career routes. His 25% TPRR versus zone was also above average (+3%) and in line with Harrison.
The Tigers used Nabers all over the formation, with only 42% of his routes coming out wide. Remember when the fantasy community was in a frenzy worrying about Jefferson’s 34% wide-alignment rate? Let’s not go there again. Remember, we have accounted for alignment in the Career Adjusted RYPTPA Index.
If you are more of a film-based thinker, only two players in the class graded as star-caliber players in the separation and route running categories in Matt Waldman’s Rookie Scouting Portfolio, and Nabers was one of them. Despite often playing from the comfort of the slot, 22% of his targets still came 20-plus yards downfield — two percentage points above the NCAA average. Nabers has the skill set to play inside or outside and challenge the vertical boundary at the next level — his target-earning and film profile tell us the same thing.
On film you can see Nabers plays with a ruggedness and competitive edge after the catch. Lance Zierlein states that Nabers offers “grab-and-go acceleration to catch it short and take it long.” He is willing to take on tacklers but has the elusiveness to force missed tackles and the acceleration to take away angles. Thanks to this ability, he posted a plus-1.1 yards after the catch per reception.
Malik Nabers Fantasy Outlook: Hit Rates and Historical Comps
- Underdog ADP: WR23, Round 3
- Rookie Dynasty ADP: WR1, Pick 2
When you add everything together, Nabers grades out close to Harrison in the Super Model, including draft capital. He is the No. 3 graded prospect since 2018. He takes a slight hit in the model without draft capital, but that is just a technicality. The 89th percentile grades out well enough to be included in the same band as Harrison but was included for the next band due to sample size.

Nabers’ ability to demand targets at a high rate and offer upside after the catch creates an interesting comp group.
- Ceiling: CeeDee Lamb
- Floor: Jerry Jeudy
Jeudy flashes at moments but only has one top-36 finish to his name. However, Lamb has developed into one of the best WRs in the game, moving all over the formation to turn short and intermediate targets into chunk plays. Nabers offers that same sort of potential.
Nabers isn’t cheap — he's already coming off the board in Round 3 of Underdog Drafts — but relative to Harrison Jr., he goes 13 WR spots later. That makes him my preferred target in that format.
If Harrison was on the board at my pick in dynasty, and I could move back a spot or two and still secure Nabers while adding draft picks, I would do it. The build-up around Harrison could lead some dynasty managers to make an offer you can’t refuse.
Tier 2 – Immediate Starter Traits with WR1 Upside
Rome Odunze | Washington
- WR Super Model: 86th percentile
- Age: 22.3
- Height: 6-foot-3
- Weight: 212
Pedigree
- Program Quality Index: 70th percentile
- NFL Mock Drafts: Pick 6, Round 1
- 247 Recruit Player Rating: 4 of 5 stars
Washington hasn’t produced the same number of high-end prospects as Alabama, Ohio State and LSU. However, John Ross and Dante Pettis were first- and second-round picks, and they have three WRs currently mocking inside the first three rounds for 2024. Odunze is going as the No. 6 pick overall, while Ja’Lynn Polk is in Round 2 and Jalen McMillan is in Round 3.
Odunze was a four-star recruit and the No. 22 overall WR in the 2020 class, in the same range as Harrison Jr. and Nabers. So, while Odunze is slightly below those two in the pedigree department, it isn’t a huge gap.
Production
- Adjusted Career RYPTPA Index: 58th percentile
- Career Total TDs Per Game Index: 60th percentile
- Career Targeted QB Rating Index: 58th percentile
While Odunze was a strong senior performer with a 2.85 RYPTPA, his Adjusted Career RYPTPA graded in the 58th percentile due to lower marks over his first three years in college, where he lagged behind Harrison and Nabers.
Based on historical data, the first three years matter the most when correlating to future fantasy production. Year 4 and Year 5 production correlates negatively — so the adjusted formula weights heavily to early career production.
The TD and QB target ratings derive from career numbers, so Odunze isn’t getting docked any extra points in the model. However, a slow start can impact the career average, just like a student who posts a poor GPA as a first-year student, and it isn’t always easy to correct.
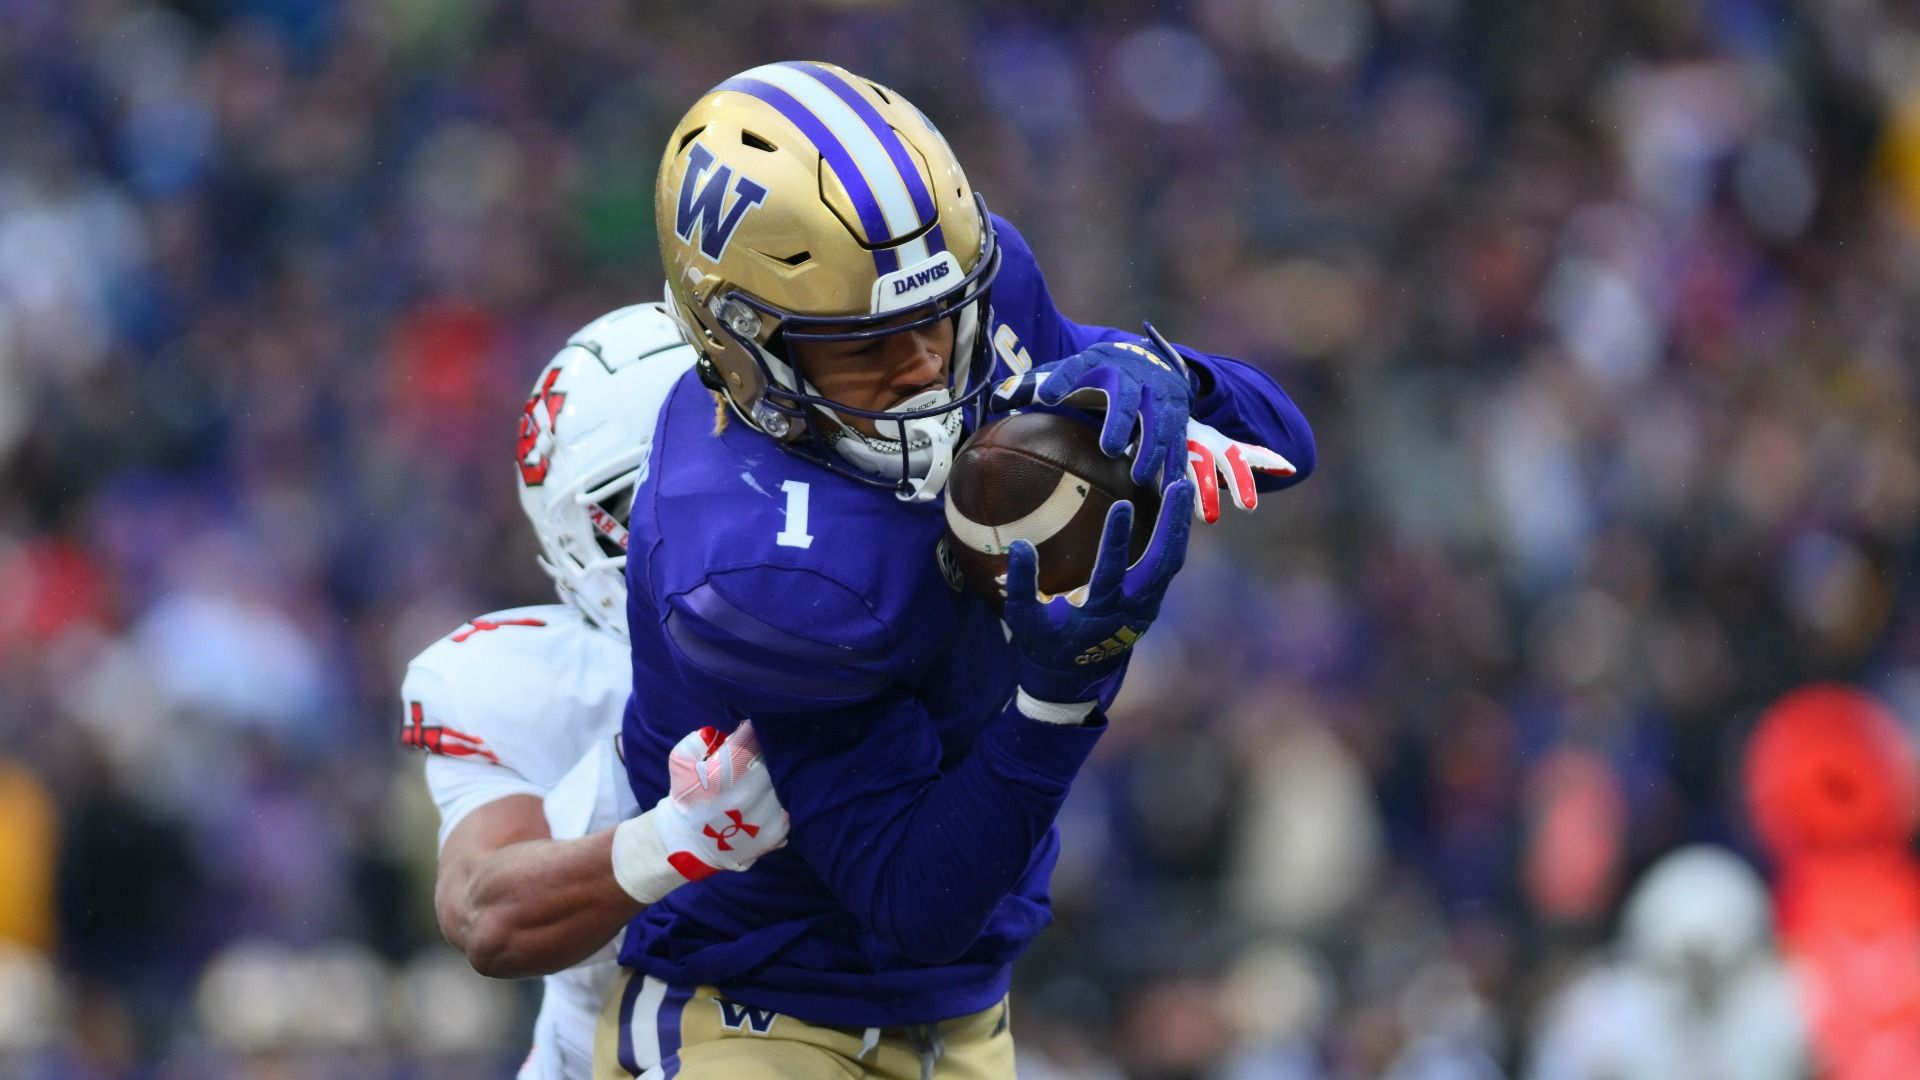
Nov 11, 2023; Seattle, Washington, USA; Washington Huskies wide receiver Rome Odunze (1) catches a pass for a touchdown while defended by Utah Utes cornerback JaTravis Broughton (4) during the second half at Alaska Airlines Field at Husky Stadium. Mandatory Credit: Steven Bisig-USA TODAY Sports
On a positive note, Odunze performed on par with Nabers, garnering a 29% TPRR against man coverage and a 25% TPRR against zone coverage. He also demonstrated a diverse mix of target depths, with 11% coming behind the line of scrimmage and 27% 20-plus yards down the field. While he can kick inside to the slot, 75% of his snaps came out wide against tougher competition and coverage help.
Partially due to many of these factors, Odunze stacks up well against the other top WRs in this class when the experts turn on the film. Lance Zierlein has him graded as the No. 1 WR in the class, comparing him to Larry Fitzgerald.
Odunze was Matt Harmon’s first-ever all-green prospect in his Reception Perception, which grades all route types against man and zone coverage.
Rome Odunze Fantasy Outlook: Hit Rates and Historical Comps
- Underdog ADP: WR31, Round 5
- Rookie Dynasty ADP: WR3, Pick 3
NFL Draft capital is the No. 1 factor in the model, and given Odunze’s high first-round expectations, he has a chance to grade out similarly to Harrison and Nabers. However, he falls into a tier below for me because of the difference between hit rates with and without draft capital.
It feels like I have been beating up on Odunze to this point, so I want to get on the record saying he offers a strong profile. He just happens to be in a class where we have two of the top three profiles we have seen in the model since 2018.
Finding a close comp for Odunze based on all his factors wasn’t easy, so I don’t want to force anything. However, since 2018, only two other WRs have improved their Super Model percentile by at least 10 percentage points in the model by adding draft capital — Jaylen Waddle and Christian Watson. Everything worked out fine for Waddle with three top-24 campaigns, but Watson hasn’t been healthy enough to judge.
Odunze is going as a top-36 WR in Round 5 of Underdog drafts. Fantasy drafters are giving him respect, just not as much as Harrison and Odunze, despite them all going back-to-back in NFL Mock drafts.
Given all the factors, the fantasy market has a sharp view of Odunze as a mid-range WR3 option. At that price, you can acknowledge his upside, respect the red flags in his profile, and avoid making significant trade-offs in opportunity costs.
In dynasty leagues, if someone in your league values Odunze similarly to the top two options in the class, it is an opportunity to trade down.
WR Super Model Inputs & Methodology
The inputs are in order of their correlation to fantasy production in a WR’s first two years in the NFL.
- Projected draft capital (NFL Mock Draft Database)
- Collegiate program quality
- Adjusted career receiving yards per team pass attempt
- Career targeted QB rating
- Career TDs per game
- Age
Because the model includes advanced data that isn’t widely available before the 2018 class, our sample focuses on WRs with at least two years of play since then. So, our correlations to future performance currently derive from WR data from 2018 to 2022.
For all production stats, the data comes from the game log level rather than the season.
Draft Capital Value
The model uses Chase Stuart’s Draft Value Chart for draft capital, which is essentially a better version of what many know as the Jimmy Johnson trade chart. The value of a draft pick isn’t linear, and this methodology helps us capture that. The dropoff in value is steeper in the first round and becomes much flatter around the end of the second round. Draft capital value is the most weighted input in the Super Model.
Program Quality Index
Program quality uses the draft capital value to determine the total value each collegiate program has contributed to the NFL Draft at the WR position since 2014. Those scores are then indexed to form the Program Quality Index.
WRs who come from stronger programs score better. Program quality has been a factor in the model before, but this is a better way of quantifying it. Additionally, this metric helps offset lower production numbers from WRs with more target competition.
I want to shout out to Billy Elder, who spawned this idea.
Adjusted Career Receiving Yards Per Team Pass Attempt Index
Yeah, that is a mouthful, huh? To help, we will shorten receiving yards per team pass attempt to RYPTPA, an acronym you will see throughout this piece. If you have a cooler name for us to use, don’t hesitate to DM me on X.
RYPTPA helps us normalize receiving yards based on the team environment, which is very important since how much a team throws can vary drastically.
The adjusted version of Career RYPTPA accounts for four critical variables that showed to impact performance:
- Age and class (i.e., first-year, second-year student, etc.)
- Average depth of target (aDOT) and alignment
- Team passer rating
- Teammate score (competition for targets)
Receivers who performed well in RYPTPA earlier in their careers enjoyed much stronger hit rates in their first two years. In fact, WRs who didn’t perform well until Year 4 and Year 5 correlated negatively with NFL success. To account for this, the model assigns heavier weights to the first three years.
This measurement also allows us to move away from breakout thresholds, which have a nasty habit of barely missing prospects, barely too low or high — everything is now on a scale.
The other three variables quantify an expected RYPTPA based on game-level data since 2014. Then, we can perform an over-expected calculation.
The higher a WR’s aDOT, the higher their expected RYPTPA. The higher a team’s passer rating, the higher a WR’s expected RYPTPA. The stronger the teammate competition, the lower the WR’s expected RYPTPA.
These four factors are then weighted and combined into one data point and indexed (placed on a scale from zero to one).
Career Targeted QB Rating Index
This metric tells us the passer rating when a WR was targeted. There is an inherent overlap between targeted QB rating and RYPTPA data points because both use yards.
However, RYPTPA tells us how a player performed in the context of their team, while targeted QB rating tells us how well a WR performed when targeted. That critical distinction allows these two metrics to work well together.
I want to shout out to Peter Howard, the first person I noticed using this data point in their model.
Career Total TDs Per Game Index
The data showed that using a normalized metric like RYPTPA was superior for receiving yards, but that wasn’t true for TDs. Instead, per-game data demonstrated a stronger correlation than share, per-team attempt and other options.
There is a correlation between yards and TDs, so once again there is some overlap in signal between our metrics. However, not all WRs who are strong in RYPTPA score a lot of TDs.
Intuitively, this makes sense because we expect WRs who can score long TDs and provide value inside the 10-yard line to have an advantage over a small slot WR with a ton of targets.
Additionally, we account for the broadness of a WR’s utility by including rushing TDs in the career total.
Age Index
A player’s age derives from how old they will be at the beginning of the upcoming NFL season. It doesn’t carry as much weight in the WR model as it used to because we already account for age in adjusted career RYPTPA.
You will notice that the dominator rating, which combines a player’s percentage of yards and TDs, is no longer in the model. Career total TDs and RYPTPA offered stronger correlations to future production, and the dominator rating was duplicative, so it didn’t make sense to keep it in the model moving forward.
You might also be wondering why target share wasn’t included — especially considering how important it is at the NFL level. The answer is twofold: 1) RYPTPA is stronger, and the two correlate strongly. 2) The targeted QB rating was stronger and offered a holistic view of efficiency that we can’t get from target share, which made it a better pairing with RYPTPA.
Published Updated