
2024 RB Rookie Super Model: Tier 2 Rookie Running Backs
Dwain McFarland dives into his RB Super Model, breaking down the best RBs in the 2024 NFL Draft class that he's broken down into Tier 2.
With the NFL Draft quickly approaching, we are releasing our updated Fantasy Life Rookie Super Model to help answer that question! We have already released WRs and TEs and are now moving on to the RB position.
Our goal is to identify the top rookie prospects based on data points that correlate most with future NFL production. I have been working on NFL rookie models for the last three years, and over that time, I have studied and measured hundreds of predraft variables against future NFL production.
This is a great time to clarify that I am not a mathematician or a coder. Yes, I have a background in data and analytics, but I am self-taught. I didn’t take a course or go to a university to study these topics. I simply love data, understanding why things work the way they do, and football.
OK, back to the point I was about to make before my disclaimer.
The truth is that most variables don’t carry a strong signal, or they overlap too much with an existing variable to make it into a model. Even once you define a list of relatively strong inputs, it is hard to accurately predict which college athletes will be the best NFL players.
Football is a sport with countless dependencies played by notoriously unpredictable creatures known as human beings. When you add in plain old variance, you can see how this activity can become challenging.
But that is what makes it so interesting, and it fuels me to test new ideas every offseason. At the RB position, our model has performed very well.
Correlations to future fantasy performance:
- Raw NFL Draft Pick: 0.58
- NFL Draft Capital Value: 0.68
- Super Model without Draft Capital: 0.68
- Super Model with Draft Capital: 0.72
So, let’s examine the inputs used for the 2024 RB Super Model and then see how the 2024 NFL Draft prospects fared. You can find the other Rookie Running Back tiers here:
- 2024 RB Rookie Super Model: Tier 1
- 2024 RB Rookie Super Model: Tier 2
- 2024 RB Rookie Super Model: Tier 3
- 2024 RB Rookie Super Model: Tiers 4 & 5
RB Super Model Inputs & Methodology Overview
The inputs below are in order of their correlation to fantasy production in an RB’s first two years in the NFL.
- Projected draft capital (NFL Mock Draft Database)
- Collegiate program quality
- Adjusted career yards per team attempt (rushing and receiving)
- Career composite PFF grades (rushing and receiving)
- NFL.com prospect grades
- Speed Score
- Career TDs per game
- Age
Because the model includes advanced data that wasn’t widely available before the 2017 class, our sample focuses on prospects with at least two years of play since then. So, our correlations to future performance currently derive from RB data from 2017 to 2022.
For all production stats, the data comes from the game log level rather than the season.
Super Model Note: the only RBs included from the 2017 class left for the NFL after three years because we don’t have data for the 2013 season to cover four-year starters from the class.
Draft Capital Value
The model uses Chase Stuart’s Draft Value Chart for draft capital, essentially a better version of what many know as the Jimmy Johnson trade chart. The value of a draft pick isn’t linear, and this methodology helps us capture that. The dropoff in value is steeper in the first round and becomes much flatter around the end of the second round. Draft capital value is the most weighted input in the Super Model.
Super Model Note: Because draft capital isn’t linear, the most significant deterioration occurs in the first two rounds. As a byproduct of that, the scores in the model drop off quickly and then begin to flatten toward the end of Round 2. That means the 45th percentile isn’t a bad score – it ranks 20th out of 215 prospects in the database. In fact, 177 out of 215 prospects are below the 35th percentile.
Program Quality Index
Program quality is a pedigree metric that uses draft capital value to determine the total value each collegiate program has contributed to the NFL Draft since 2015. The model uses a composite score derived from two inputs.
- Program draft capital at the RB position
- Program draft capital at the RB, WR and TE positions
Those scores are then indexed to form the Program Quality Index.
Prospects who come from more robust programs score better. Program quality has been a factor in the model before, but this is a better way of quantifying it. Additionally, this metric helps offset lower production numbers from prospects with more competition.
The weighting for pedigree is intentionally lower than the correlation to future production suggests because program quality creates a double-counting effect for draft capital. While we want prospects from schools that churn out high draft picks, that particular player’s draft capital is included in program quality when we look back at the model. This is also why we use a program quality score focused on RB, WR and TE in the RB model.
I want to shout out to Billy Elder, who spawned this idea.
Adjusted Career Yards Per Team Attempt Index
Adjusted career YPTA is a production metric that allows us to normalize yards based on the team environment, which is essential because team volume varies from one situation to the next. A prospect averaging 75 yards per game in a low-volume offense might be better than another averaging 100 yards on a high-volume squad per-team-attempt basis.
Receiving yards are worth twice as much as rushing yards in this equation. This gives us a better approximation of value versus half and full-PPR formats.
Equation: (rushing yards + receiving yards*2) / (team rushing attempts + passing attempts)
Career Composite PFF Grade Index
This qualitative metric is based on a player’s career PFF Rushing Grade and PFF Receiving Grade. If you wonder how PFF Grades work, I recommend reading Steve Palazzolo’s breakdown. But below are two excerpts that can get you by if you just want the basics.
“Credit is given for each move the running back makes to add value to the play, whether forcing a missed tackle, using speed to gain the edge or creating yards through contact.”
“Our goal is to isolate the running back’s contribution to that production, and the runners with the highest grades are those who produce above expectation and outside what the run blocking or scheme allows.”
PFF Grades account for context we otherwise can’t capture at such a massive scale. Because of this, it isn’t surprising that grades correlate more strongly to future production than individual statistics, such as missed tackles forced, yards after contact, and explosive plays. Plus, it allows us to concisely present that information in one data point.
Super Model Note: We are calculating the career grades based on season grades weighted by rushing attempts and passing targets.
NFL.com Prospect Grade Index
This is another qualitative metric based on Lance Zierlien’s prospect grades on NFL.com. His prospect scores have a 0.59 correlation to Year 1 and Year 2 RB fantasy production since 2017, which was strong enough to add a film element to the Super Model.
The grades are indexed on a scale of 0 to 1.
Speed Score
I tested all NFL Combine and pro day data, including RAS (relative athletic scores) for all positions. While most athletic tests show some signal, they aren’t strong enough to make it into the model. However, for RB, Speed Score garnered a 0.31 correlation to future production and offered relatively low overlap with the other data points in the model.
Speed Score combines a player’s weight with 40-yard dash time (weight*200)/(40-time^4), offering a significantly stronger signal over 40 times alone. Bill Barnwell of ESPN created Speed Score.
Career Total TDs Per Game
This is another production metric. The data showed that using a normalized metric like YPTA was superior for receiving yards, but that wasn’t true for TDs. Instead, per-game data demonstrated a stronger correlation than share, per-team attempt, and other options.
There is a correlation between yards and TDs, so once again, there is some overlap in signal between our metrics—however, not all RBs who are strong in YPTA score a lot of TDs.
Age Index
A player’s age derives from how old they will be at the beginning of the upcoming NFL season. Historically, younger players and early-declares carry a stronger signal than older prospects.
Tier 2 – Committee Traits With RB2 to RB3 Potential
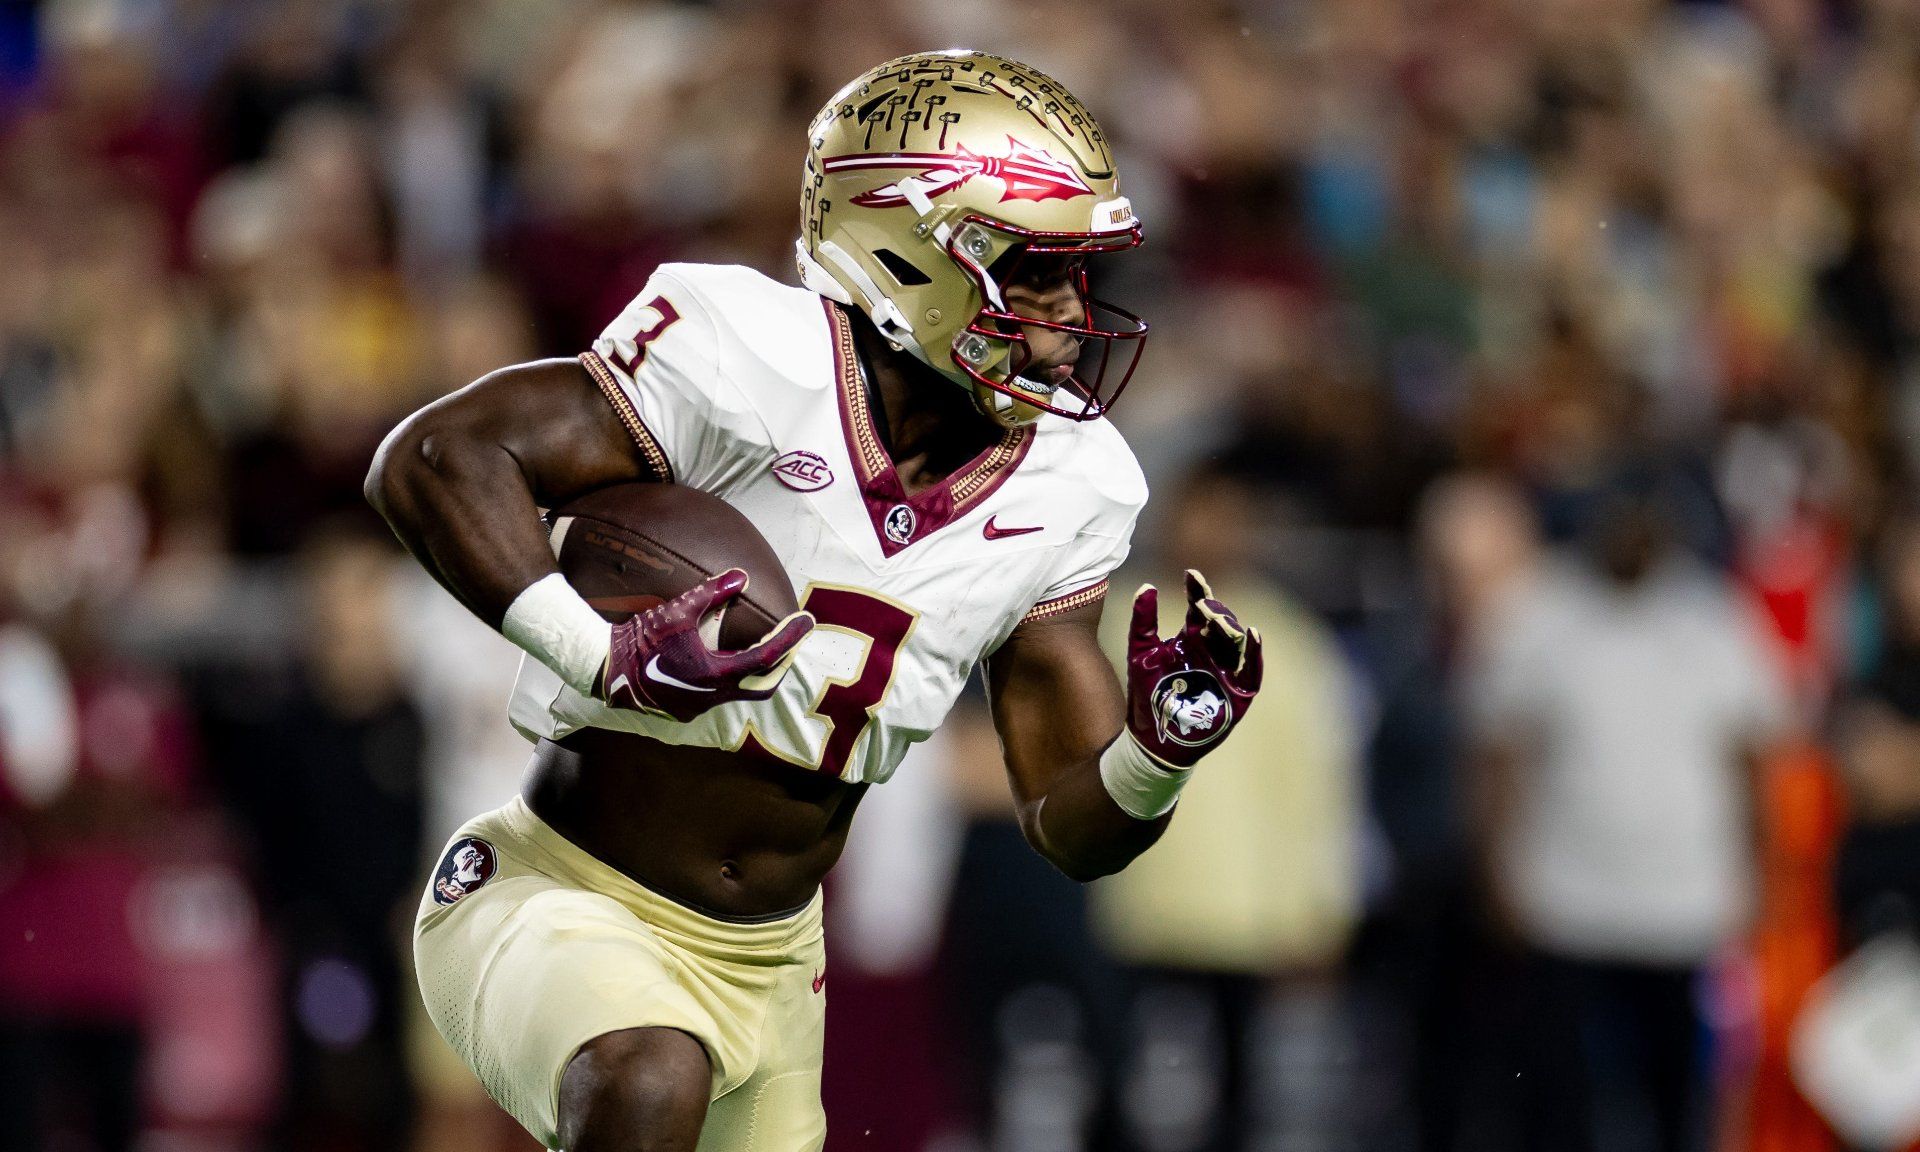
Trey Benson | Florida State
- RB Super Model: 38th percentile
- Age: 22.1
- Height: 6-foot
- Weight: 216
- Trey Benson Scouting Report via Jonathan Fuller
Prospect Summary
Benson grades out reasonably well as a rusher in the Super Model, but he doesn’t profile as a solid every-down option due to his lack of receiving chops. He could still offer three-down viability in the right situation but likely won’t ever be more than a check-down option.
Pedigree and Athleticism
- Program Quality Index: 48th percentile
- NFL Mock Drafts: Pick 59, Round 2
- 247 Recruit Player Rating: 4 of 5 stars (372 overall, RB27)
- Speed Score Index: 78th percentile
Benson began his career at Oregon before transferring to Florida State as a redshirt sophomore. Since 2017, the Seminoles have produced two Round 2 RB picks in Dalvin Cook and Cam Akers.
The four-star recruit didn’t receive offers from many elite pedigree schools like Alabama, Georgia or LSU, but Penn State made a run at Benson. He ranked 15 spots behind Blake Corum and three spots ahead of Israel Abanikanda in the 2020 recruiting class.
Benson’s mock draft stock has risen from the third to the second round since the NFL Combine, where he posted a 4.39 40-yard dash, leading to a 78th percentile Speed Score of 116.3. Based on all the variables I have tested against NFL Draft capital, Benson checks many of the boxes that teams care about. It is hard to say if he will get the Round 2 capital, but a Day 2 pick feels like a safe projection.
Production and Film
- Adjusted Career YPTA Index: 45th percentile
- Career Total TDs Per Game Index: 48th percentile
- Career Composite PFF Grade Index: 59th percentile
- NFL.com Prospect Grade Index: 48th percentile
Benson missed the 2020 season due to an ACL injury and only played in two games as a redshirt freshman in 2021. In his first year at Florida State, he handled 33% of the designed rushing attempts before expanding into a 40% role in his final season.
However, the time-share back posted an 83rd-percentile career PFF Run Grade (88.8), forcing a 0.39 missed tackles forced rate — the No. 1 mark in the Super Model database. Matt Waldman graded Benson’s speed and acceleration as star caliber — one of only three prospects to check both boxes.
Benson would have graded far higher had he been a workhorse back over multiple seasons with this sort of grade, but in this case it is enough for us to keep an open mind about his potential in a more significant role at the next level.
Florida State Seminoles running back Trey Benson (3) rushes with the ball during the first half against the Florida Gators at Steve Spurrier Field at Ben Hill Griffin Stadium in Gainesville, FL on Saturday, November 25, 2023. [Matt Pendleton/Gainesville Sun]
Benson wasn’t used often on passing downs, with a career-high route participation rate of 34%, and his 40th-percentile PFF Receiving Grade wasn’t ideal. His profile has shades of a one-dimensional prospect who could struggle to find his legs in the passing attack.
Ultimately, Benson’s inability to take over a more significant rushing workload earlier in his career or secure passing-down work hurt his YPTA. He never eclipsed a 2.0 mark in a single season — his highest finish was 1.66 as a 21-year-old. While his rushing grade holds up against Brooks, his Career Composite PFF Grade Index is much lower at the 59th percentile.
Still, Zierlein believes Benson has the tools to improve in pass protection and is a capable receiver on underneath routes. That archetype won't carve out targets from better receivers, but it could open the door to a three-down role and help pad the stat line with checkdowns — especially on teams without two strong passing game weapons.
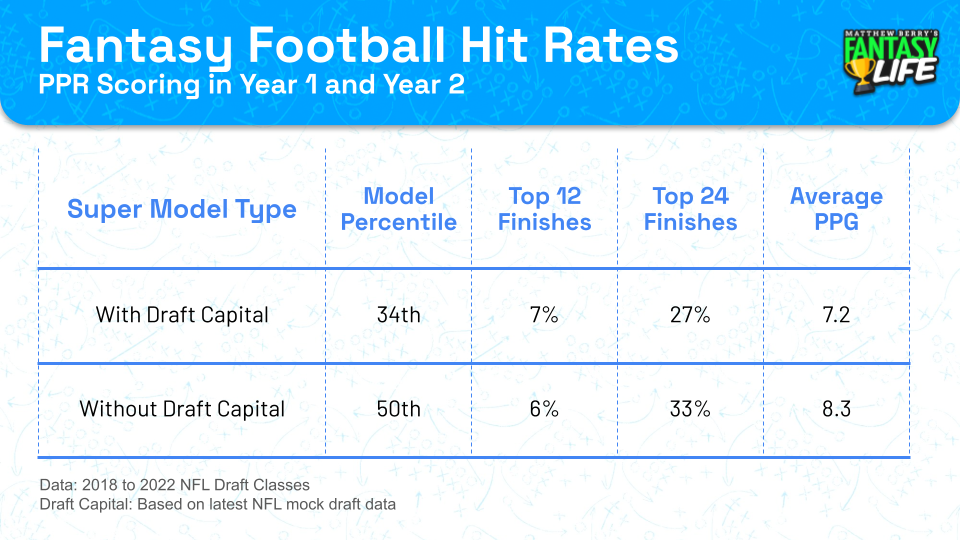
Trey Benson Fantasy Outlook: Hit Rates
- Underdog ADP: RB31, Round 9
- Rookie Dynasty ADP: RB1, Pick 10
The step down from Brooks to Tier 2 shows up in a big way in the hit rates with and without draft capital included. However, in the right landing spot, this type of prospect still offers a decent shot at a top-24 finish and an outside chance at a top-12 season in Year 1 or 2.
Despite the ACL injury, I still want Brooks over Benson in dynasty leagues. It is much closer in formats only focused on the 2024 season. Health reports and landing spots will be factors.
While Benson isn’t as flashy as the jump-cutting Kenneth Walker, it is a good high-end comp based on their more one-dimensional profiles. Damien Harris and Trey Sermon also fall into the same range in the without-draft-capital model.

Jaylen Wright | Tennessee
- RB Super Model: 34th percentile
- Age: 21.4
- Height: 5-foot-10
- Weight: 210
Prospect Summary
Wright is a boom-bust prospect. He offers the size and speed NFL teams covet and performed well when given the opportunity at Tennessee but was never able to carve out a full-time role.
Pedigree and Athleticism
- Program Quality Index: 41st percentile
- NFL Mock Drafts: Pick 75, Round 3
- 247 Recruit Player Rating: 3 of 5 stars (659 overall, RB40)
- Speed Score Index: 73rd percentile
Since 2015, the Volunteers have produced two draft-worthy RBs, one of whom is superstar Alvin Kamara, who transferred from Alabama. Beyond that, they haven’t produced much on offense, but things have warmed up recently, with Velus Jones Jr., Jalin Hyatt and Cedric Tillman all earning Round 3 capital at the WR position.
Wright received offers from multiple Power 5 programs, but as a three-star recruit, he wasn’t courted by the upper-echelon teams. He weighed only 187 pounds when arriving in Tennessee, adding 23 pounds to his frame before his departure.
Since January, Wright’s stock has climbed from 150 to the top 75 in mock drafts. His 4.38 40-yard dash, 38-inch vertical and 134-inch broad jump at the NFL Combine caught the eye of many analysts. While the Speed Score is only a small fraction of the model, it carries a signal, and Wright’s 114.1 falls in the 73rd percentile.
Production and Film
- Adjusted Career YPTA Index: 33rd percentile
- Career Total TDs Per Game Index: 26th percentile
- Career Composite PFF Grade Index: 67th percentile
- NFL.com Prospect Grade Index: 52nd percentile
Wright found his way into a limited role, handling 25% of the Volunteer’s designed rushing attempts as an 18-year-old freshman. Unfortunately, that role only expanded to 33% and 34% over the subsequent two campaigns. His route participation maxed out at 25% with a 7% target share.
Thanks to his limited role, Wright’s adjusted YPTA peaked at 1.61 as a junior, finishing his career at 1.12. When you pair that with his 0.5 TDs per game, the former three-star recruit scores poorly in the production component of the Super Model.
However, his 71st-percentile career PFF Rush Grade and 60th-percentile Receiving Grade come together to give him a strong Composite PFF Grade Index (67th percentile). Despite his limited role, Wright led Tennessee with 875 and 1,013 rushing yards in his sophomore and junior seasons. The fact that he delivered when given the opportunity and tested so well athletically means there is a chance more is lurking beneath the surface with Wright.

Nov 25, 2023; Knoxville, Tennessee, USA; Tennessee Volunteers running back Jaylen Wright (0) runs the ball against the Vanderbilt Commodores during the first half at Neyland Stadium. Mandatory Credit: Randy Sartin-USA TODAY Sports
Lance Zierlein compared him to Melvin Gordon and gave him a grade of 6.33, noting Wright offers sprinter’s speed for long TDs and sticky hands with room to grow as a route runner. Matt Waldman observed a similar upside in Wright’s receiving game, listing him as one of the backs with a chance to contribute early on third downs. Tony Pollard was one of Waldman’s top comps.
That combination makes Wright a very intriguing prospect for fantasy purposes. He has the size to become an every-down back and we covet big-play potential paired with pass-catching prowess.
Zierlein has a good track record with RBs, and he and Waldman have me wondering if the Super Model isn’t high enough on Wright despite integrating a film component.
Jaylen Wright Fantasy Outlook: Hit Rates
- Underdog ADP: RB42, Round 12
- Rookie Dynasty ADP: RB4, Pick 16
Wright’s low-end production is a red flag. When analyzing players with a similar production profile, the only successful ones came from loaded programs. They were stuck behind other superstars. Think of names like Josh Jacobs, Brian Robinson Jr. and James Cook. I don’t think we can give Wright that same pass — he didn’t play at Alabama or Georgia.
However, his profile offers upside based on how well he performed when given the chance, and those qualities align with his film grades and Speed Score. Due to those factors, his hit rates still promise a top-24 or even a top-12 performer on par with Benson. However, you can draft him three rounds later in best-ball formats and six picks later in rookie drafts. Given those factors, Wright is my preferred target — give me the cheaper option from the same tier.
Blake Corum | Michigan
- RB Super Model: 32nd percentile
- Age: 23.8
- Height: 5-foot-8
- Weight: 205
- Blake Corum Scouting Report via Jonathan Fuller
Prospect Summary
Corum’s age and low Speed Score hurt him in the model, but his production and quality of play speak for themselves. He wasn’t a high-end receiving option in college but offers every-down upside in the right situation.
Pedigree and Athleticism
- Program Quality Index: 36th percentile
- NFL Mock Drafts: Pick 71, Round 3
- 247 Recruit Player Rating: 4 of 5 stars (129 overall, RB12)
- Speed Score Index: 35th percentile
While the Michigan Wolverines might be national champions, their offensive players haven’t made much noise in recent years of the NFL Draft. Since 2015, they have produced four third-rounders or higher, with Nico Collins as the most notable prospect.
However, Corum was a high-recruited prospect with 28 offers, including high-echelon programs like Georgia, Ohio State, LSU and Penn State. I always like to keep this in mind when balancing out a player’s pedigree. If Corum had produced at the same level at Georgia, the model would like him more — this is something we will seek to adjust for in next year’s iteration if the signal is strong.
In early February, Corum was a top-40 pick in mock drafts, but his value plummeted over 30 spots into the 70s. After the NFL Combine, he dipped as low as the mid-90s. Corum’s 40-time unto itself wasn’t slow (4.53), but combined with his 205-pound frame it produced a 35th-percentile Speed Score of 97.4. However, he has leveled back off in the high 70s in Round 3.
Production and Film
- Adjusted Career YPTA Index: 50th percentile
- Career Total TDs Per Game Index: 75th percentile
- Career Composite PFF Grade Index: 72nd percentile
- NFL.com Prospect Grade Index: 45th percentile
Corum played in only six games as a freshman but moved into a larger role as his career progressed. Over his final three seasons, he handled 30% (144), 51% (248) and 50% (258) of the Wolverines' designed rushing attempts. He has demonstrated the ability to handle a large workload, reaching 20.7 attempts per game in his best campaign.
If you were to look only at yards after contact (30th percentile), missed tackles forced (43rd percentile) and explosive rush rate (12th percentile), you might see Corum as a high-volume back without much upside.
However, his career PFF Run Grade is in the 84th percentile and takes far more context into consideration. Being a good running back is about adding value based on the situation, and Corum might not be flashy, but he knows how to get the job done. To be fair, Lance Zierlein offers a contrasting view. He doesn’t love his ability to create big plays due to challenges at the second level and acceleration concerns. Zeirlein states that Corum “wears down defenses with volume rather than power.”
It is also worth noting that Corum suffered a torn meniscus at the end of his junior season. His run grades were 91.1 and 96.2 as a sophomore and junior before dipping to 83.1 as a senior. The knee injury might have been a contributing factor. Corum already has the sixth-highest PFF Run Grade in the Super Model database, and he might have made a run at No. 1 without the injury.
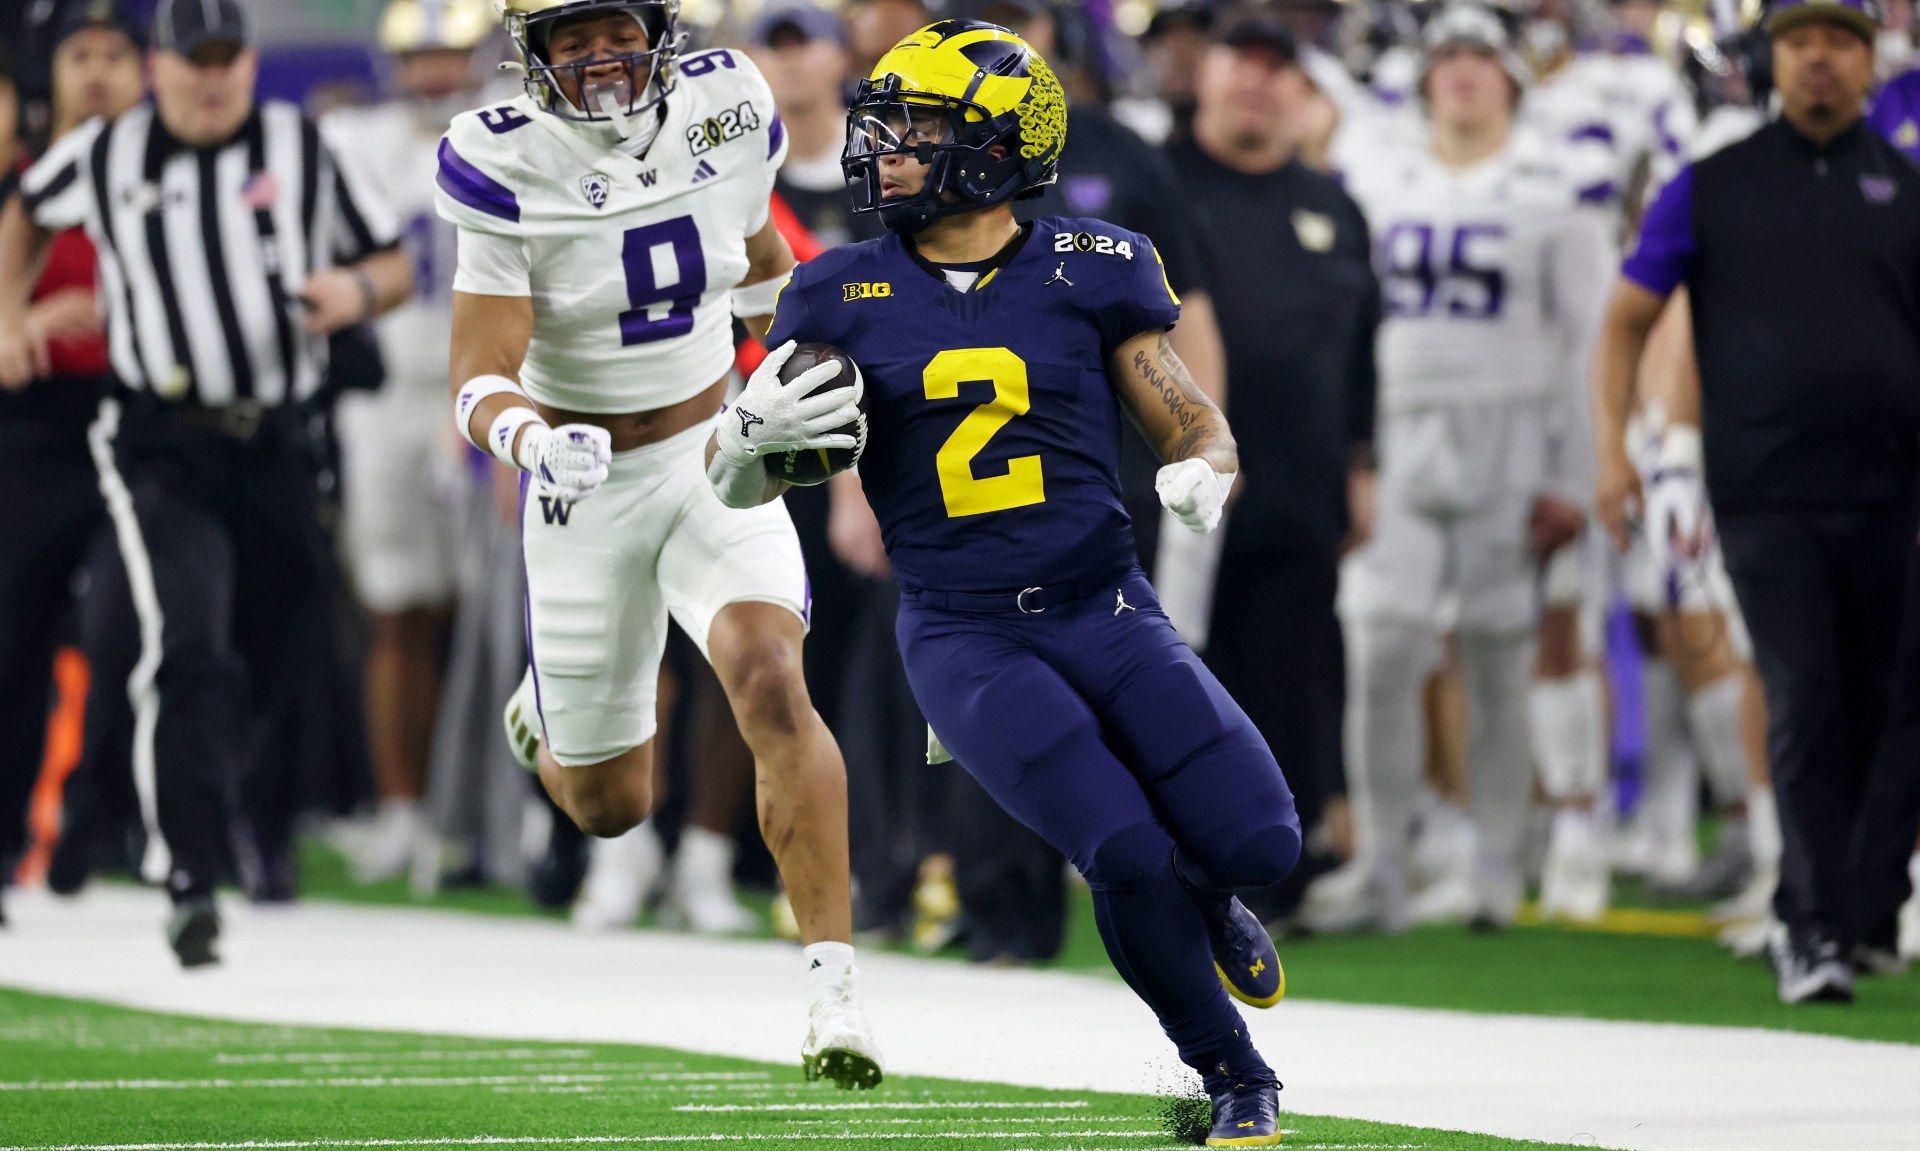
Jan 8, 2024; Houston, TX, USA; Michigan Wolverines running back Blake Corum (2) runs with the ball against the Washington Huskies during the second quarter in the 2024 College Football Playoff national championship game at NRG Stadium. Mandatory Credit: Thomas Shea-USA TODAY Sports
Given Corum’s middle-of-the-road Adjusted Career YPTA Index, you have probably already figured out that his production as a receiver must have been lackluster, knowing how well he performed on the ground. And you would be correct.
Corum’s career-high route participation of 40% and 7% career target share aren’t inspiring. But his PFF Receiving Grade came in at the 58th percentile, and Matt Waldman rated Corum’s receiving ability as starter caliber but noted he isn’t a “one-on-one route winner beyond the shallow range of the field, but he can wreak havoc as an underneath receiver when called upon.”
The data backs Waldman’s analysis. Corum saw 54% of his targets come 0 to 9 yards downfield, 14 percentage points above the NCAA average for RBs. His target rate behind the line of scrimmage was 45%, seven percentage points below the average. Corum might not be a downfield mismatch, but his profile offers more than swing pass and dump-off utilization.
When you put it all together, Corum’s Career Composite PFF Grade Index comes in at the 72nd percentile — primarily due to his rushing prowess. Still, he offers the ability to become an every-down back, and Waldman compares him to another get-the-job-done back who eventually turned into a highly productive NFL back: Ray Rice.
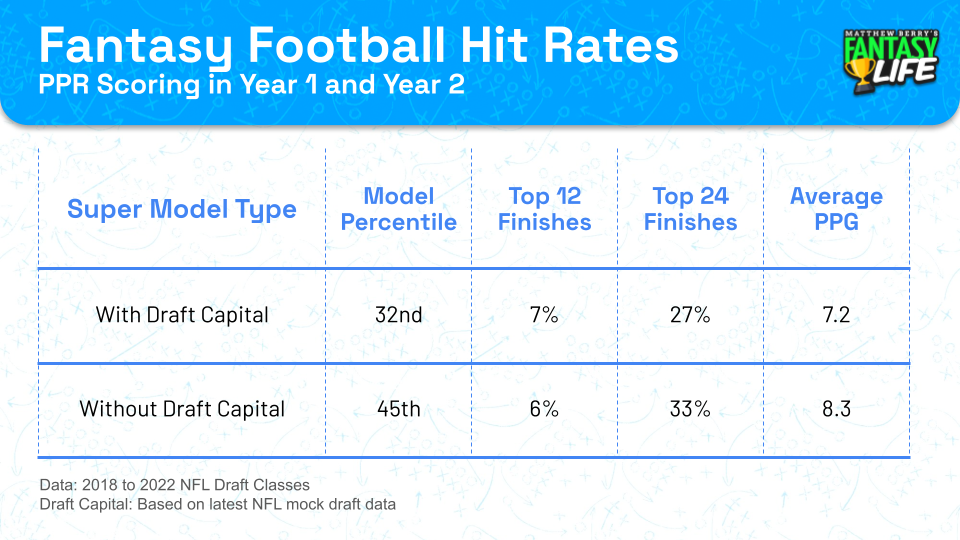
Blake Corum Fantasy Outlook: Hit Rates
- Underdog ADP: RB40, Round 11
- Rookie Dynasty ADP: RB3, Pick 15
Corum won’t offer the sizzle some drafters are looking for, but he has enough positive traits to land in the same tier as Benson and Wright. Given his proven ability to handle a workload, he might offer a more robust floor. The beauty of creating tiers is that we are playing percentages, and Corum provides the same hit rates as Benson but at a lower cost.
Braelon Allen | Wisconsin
- RB Super Model: 31st percentile
- Age: 20.6
- Height: 6-foot-1
- Weight: 235
- Braelon Allen Scouting Report via Jonathan Fuller
Prospect Summary
Based on his production and workload capacity, Allen could develop into a volume-based early-down runner at the next level. He has the size NFL teams covet but hasn’t shown he is a high-quality runner. Despite decent pass-blocking skills that could get him on the field on third downs, he doesn’t offer much upside as a receiver.
Pedigree and Athleticism
- Program Quality Index: 56th percentile
- NFL Mock Drafts: Pick 105, Round 4
- 247 Recruit Player Rating: 4 of 5 stars (227 overall, LB25)
- Speed Score Index: N/A
Allen has an interesting background. First, he graduated high school a year early, making him the youngest RB in the model, only 20.6 when the 2024 NFL season starts. Second, while Allen played RB in high school, he was recruited as a linebacker. He immediately switched to RB, eventually taking over the starting role as a 17-year-old freshman.
Wisconsin has produced Melvin Gordon (Round 1) and Jonathan Taylor (Round 2). At TE and WR, the list includes Jake Ferguson (Round 4 pick), Troy Fumaglli (Round 5) and Quintez Cephus (Round 5).
Allen was mocked in the pick-80 range until late March but has fallen toward pick 100. Allen opted not to run at the NFL Combine or his Pro Day, which is alarming because his last known 40-yard time is 5.10 from the Nike SPARQ Combine in 2020. However, Allen has the size that some teams love, and I won’t be surprised if he goes as early as Round 2.
Production and Film
- Adjusted Career YPTA Index: 60th percentile
- Career Total TDs Per Game Index: 56th percentile
- Career Composite PFF Grade Index: 43rd percentile
- NFL.com Prospect Grade Index: 43rd percentile
Allen bogarted 41% of the Badgers’ designed rushing attempts before he was even 18 as a freshman. He closed out his final two seasons with 54% and 53% of the team’s carries. His 17.5 career attempt average is impressive — the best mark in the class for a Power 5 back.
While he demonstrated an ability to handle a significant workload early and often, his career PFF Rushing Grade fell in the 54th percentile, which ranks fifth-worst in the class. On top of that, Allen wasn’t strong in the receiving grades, either, with a 37th percentile finish.
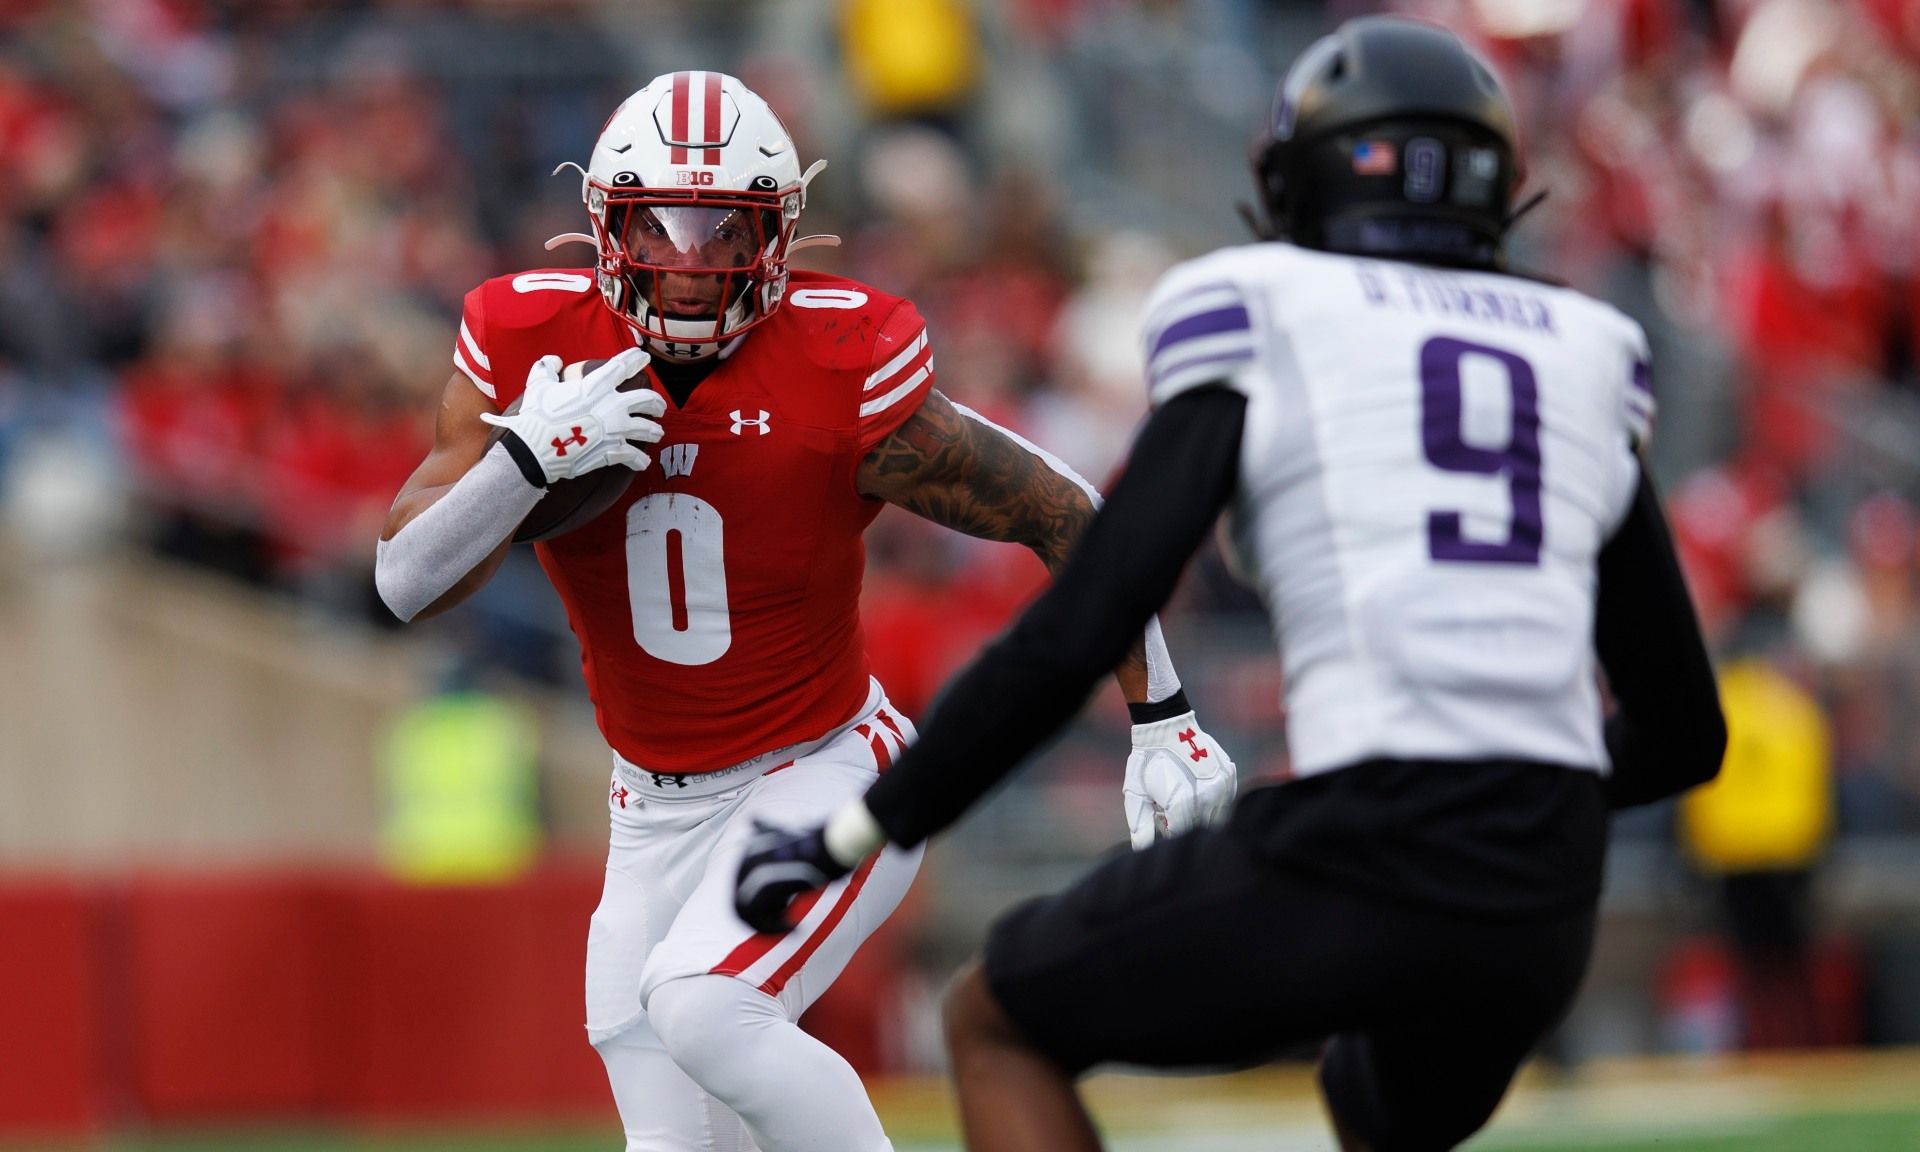
Nov 11, 2023; Madison, Wisconsin, USA; Wisconsin Badgers running back Braelon Allen (0) rushes with the football as Northwestern Wildcats defensive back Devin turner (9) defends during the first quarter at Camp Randall Stadium. Mandatory Credit: Jeff Hanisch-USA TODAY Sports
Ultimately, his adjusted career YPTA (1.84) is the third-best in the class (60th percentile), but his Career Composite PFF Grade Index (43rd percentile) is the second-worst. While our sample size isn’t huge, that combination has provided us with an uninspiring comparison group.
- A.J. Dillon (61st percentile adjusted career YPTA, 41st percentile composite PFF grade)
- Samaje Perine (60th percentile, 49th percentile)
- Benny Snell Jr. (58th percentile, 39th percentile)
These players have found a way to stick around in the NFL as backups or committee players, but they have primarily relied on team injuries to open the door for spike-week production. Lance Zierlein labeled him a “good backup with the potential to develop into a starter,” which is kind of scary, given the comps.
Braelon Allen Fantasy Outlook: Hit Rates
- Underdog ADP: RB48, Round 14
- Rookie Dynasty ADP: RB5, Pick 17
Overall, Allen falls in the same tier as Wright, Corum and Benson, and in the pre-draft-capital model, he ranks the highest of the group. That means I want to be open to taking him despite the concerning comp group outlined above. Still, I would lean toward the other names if forced to choose between backs in this tier. They are all close, and personal preference is a fine tiebreaker.
Allen is a target in fantasy drafts occurring before the NFL Draft. Based on the NFL’s history, I believe there is a considerable chance he will go earlier than Round 4, as we see in mocks. So, I want my exposure before his price rises.

Published Updated