2024 RB Rookie Super Model: Tiers 4 & 5 - The Best RBs In The NFL Draft
Dwain McFarland dives into his RB Super Model, breaking down the best RBs in the 2024 NFL Draft class that he's broken down into Tiers 4 and 5.
With the NFL Draft quickly approaching, we are releasing our updated Fantasy Life Rookie Super Model to help answer that question! We have already released WRs and TEs and are now moving on to the RB position.
Our goal is to identify the top rookie prospects based on data points that correlate most with future NFL production. I have been working on NFL rookie models for the last three years, and over that time, I have studied and measured hundreds of predraft variables against future NFL production.
This is a great time to clarify that I am not a mathematician or a coder. Yes, I have a background in data and analytics, but I am self-taught. I didn’t take a course or go to a university to study these topics. I simply love data, understanding why things work the way they do, and football.
OK, back to the point I was about to make before my disclaimer.
The truth is that most variables don’t carry a strong signal, or they overlap too much with an existing variable to make it into a model. Even once you define a list of relatively strong inputs, it is hard to accurately predict which college athletes will be the best NFL players.
Football is a sport with countless dependencies played by notoriously unpredictable creatures known as human beings. When you add in plain old variance, you can see how this activity can become challenging.
But that is what makes it so interesting, and it fuels me to test new ideas every offseason. At the RB position, our model has performed very well.
Correlations to future fantasy performance:
- Raw NFL Draft Pick: 0.58
- NFL Draft Capital Value: 0.68
- Super Model without Draft Capital: 0.68
- Super Model with Draft Capital: 0.72
So, let’s examine the inputs used for the 2024 RB Super Model and then see how the 2024 NFL Draft prospects fared. You can find the other RB tiers here:
- 2024 RB Rookie Super Model: Tier 1
- 2024 RB Rookie Super Model: Tier 2
- 2024 RB Rookie Super Model: Tier 3
- 2024 RB Rookie Super Model: Tiers 4 & 5
RB Super Model Overview
The inputs below are in order of their correlation to fantasy production in an RB’s first two years in the NFL.
- Projected draft capital (NFL Mock Draft Database)
- Collegiate program quality
- Adjusted career yards per team attempt (rushing and receiving)
- Career composite PFF grades (rushing and receiving)
- NFL.com prospect grades
- Speed Score
- Career TDs per game
- Age
Adjusted yards per team pass attempt (YPTA) normalizes RB production across different team environments. It doubles the value of receiving yards.
Formula: (rushing yards + receiving yards*2) / (team rushing attempts + passing attempts)
Super Model Note: The Super Model doesn’t count games missed against a player’s per-attempt stats like YPTA; it uses team attempts only from the games played as the denominator.
If you want all the details and reasoning behind the inputs and methodology, they are outlined in the RB Super Model Inputs & Methodology at the bottom of this page.
Tier 4 – Backup Traits With RB3 to RB5 Potential
Ray Davis | Kentucky
- RB Super Model: 22nd percentile
- Age: 24.8
- Height: 5-foot-8
- Weight: 211
Prospect Summary
Davis isn’t a high-end pedigree prospect but could develop into a three-down option with time. His best path to immediate relevance is as an early-down or short-yardage back on a team looking to improve its interior run game. He is an older prospect, but COVID-19 and a season-ending toe injury were factors.
Pedigree and Athleticism
- Program Quality Index: 27th percentile
- NFL Mock Drafts: Round 4
- 247 Recruit Player Rating: 3 of 5 stars (1,812 overall, RB116)
- Speed Score Index: 44th percentile
As a recruit, Davis wasn’t a highly touted prospect, receiving offers from only three Power 5 programs. Temple initially recruited him, and he played 12 games as a freshman and four games during his sophomore year before opting out due to COVID-19.
He transferred to Vanderbilt, where he played two more campaigns, before transferring again to Kentucky, where he used his final year of eligibility gained from the COVID-19 opt-out. Davis is the third-oldest RB prospect in the Super Model database.
Production and Film
- Adjusted Career YPTA Index: 59th percentile
- Career Total TDs Per Game Index: 50th percentile
- Career Composite PFF Grade Index: 57th percentile
- NFL.com Prospect Grade Index: 46th percentile
While Davis is an old prospect, it is a little deceiving due to the COVID-19 season, plus a toe injury that limited him to three games in his third year. He didn’t face the sort of competition for snaps you see at programs like Alabama and Ohio State, but Davis did his part by commanding 46% of Temple’s designed run attempts as a true freshman.
Davis dominated the Kentucky backfield in his fifth season by bogarting 65% of the designed attempts and posting a 62% route participation. That led to a best-season 2.58 adjusted YPTA (67th percentile), pushing his career mark to 1.80 (59th percentile).
When breaking down Davis' quality of play, the PFF data and film gurus align. He was a stronger runner than a receiver. Per PFF grades, he scored in the 67th percentile as a rusher and fell in the 48th percentile as a receiver for his career.
Zierlein gave Davis a 6.17 prospect grade, which equates to a “good backup with the potential to develop into a starter.” Zierlein viewed Davis as a potential three-down option with toughness between the tackles but a need to step up his pass protection.
Waldman gave Davis star- or starter-caliber grades in six of his 10 skill-based trait categories and praised his short-yardage skills. However, Davis graded out at the reserve- or free-agent-caliber in blocking, routes and receiving. He noted Davis is a capable swing-pass or check-down option but didn’t see him as a well-rounded receiving threat.
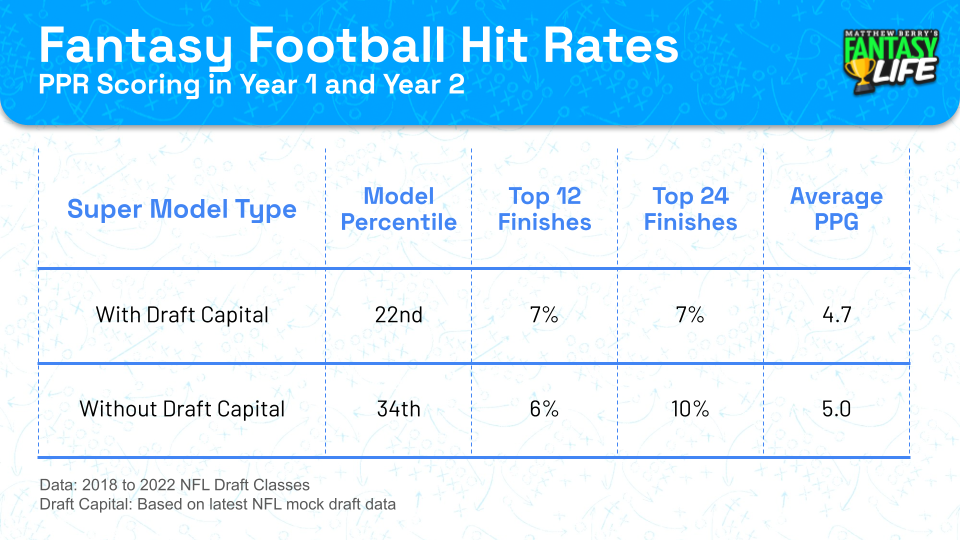
Fantasy Outlook: Hit Rates
- Underdog ADP: RB58, Round 16
- Rookie Dynasty ADP: RB9, Pick 31
If Davis were going to be 22.8 when the NFL season starts instead of 24.8, he would have been in Tier 3. The Super Model doesn’t make excuses for age, but given the factors surrounding Davis, you could argue that the model needs to improve in this area.
However, Davis doesn’t have a strong pedigree, and while his production was solid in his early seasons, it wasn’t elite. Typically, we want low-pedigree players to offer a high-end production or athletic profile, and Davis doesn’t check either of those boxes. Due to that, I am good with how the model has balanced out his prospect profile.
Jase McClellan | Alabama
- RB Super Model: 21st percentile
- Age: 22.2
- Height: 5-foot-10
- Weight: 221
Prospect Summary
McClellan won’t be a high NFL Draft pick. He lacks the speed and explosiveness to move up the board. Still, if he gets an opportunity, he has the size and skill set to become a functional back that can provide fantasy value in spurts, similar to Brian Robinson Jr. and Damien Harris.
Pedigree and Athleticism
- Program Quality Index: 100th percentile
- NFL Mock Drafts: Round 7
- 247 Recruit Player Rating: 4 of 5 stars (47 overall, RB6)
- Speed Score Index: 44th percentile
The former top-50 recruit received offers from all of the top pedigree programs including, Georgia, LSU, Texas and Penn State. During his tenure at Alabama, he played with Najee Harris, Brian Robinson Jr. and Jahmyr Gibbs.
McClellan didn’t participate in the NFL Combine, so the only verified 40-yard dash times we have are from the recruiting process, where he posted a 4.55. He is considered a late-round NFL Draft prospect.
Production and Film
- Adjusted Career YPTA Index: 37th percentile
- Career Total TDs Per Game Index: 34th percentile
- Career Composite PFF Grade Index: 57th percentile
- NFL.com Prospect Grade Index: 37th percentile
Playing in a loaded backfield, McClellan’s most extensive workload didn’t come until his final season, with 43% of the designed rush attempts and 41% route participation. Health was also a factor. He only played in five games as a sophomore due to a season-ending ACL injury.
McClellan’s 1.22 adjusted career YPTA is on the low end of the spectrum, and the same is true for his best-season mark of 1.50 (34th percentile). However, we have seen poor career and best-season adjusted YPTA scores from Alabama backs before.
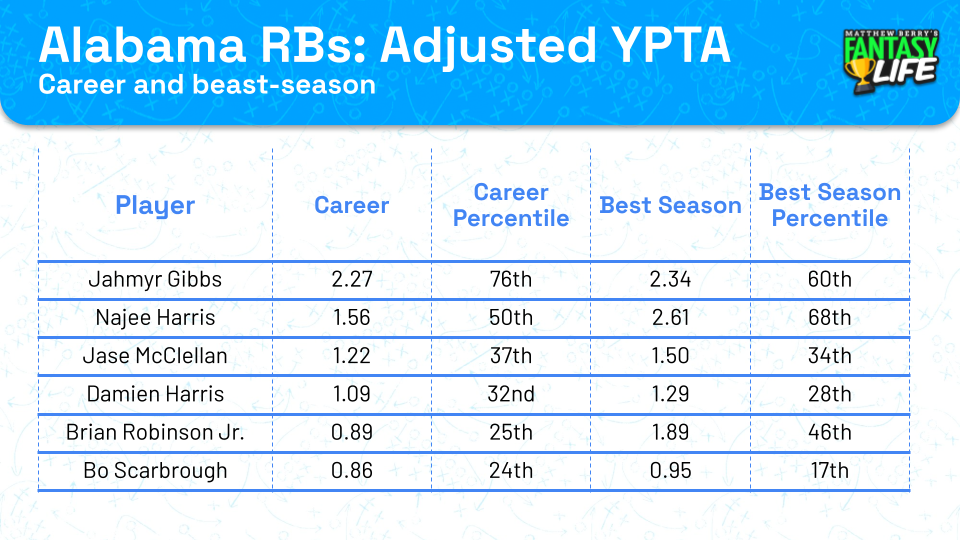
Gibbs and Harris stand out on this list, but Harris and Robinson became viable fantasy assets despite low numbers. This is an excellent example of why the Program Quality Index matters for evaluating RB talent–it helps offset lower production from backs playing in loaded backfields.
Of course, we must also look at play quality to avoid pure logo scouting. That is where the PFF and NFL.com grades enter the picture.
McClellan had similar career composite PFF Grades to Harris (55th percentile) and Robinson (56th percentile). It is worth noting that McClellan posted a 1.4 career aDOT. The best-receiving RBs in the NFL usually have positive aDOTs, and McClellan collected 59% of his targets 0 to 9 yards from the line of scrimmage–well above the NCAA average of 40%.
Mclellan finished his career with a 0.28 missed tackles forced rate (62nd percentile), and his PFF Run Grade (62nd percentile) was on par with all of the previous Alabama backs except Harris. He wasn’t as strong in the receiving department (52nd percentile) as Gibbs, Harris and Jacobs, but he was better than Robinson (41st percentile) and was in the same range as Harris (59th percentile).
However, McClellan (37th percentile) was lower than Harris and Robinson in Lance Zierlein's grading process at NFL.com. The two former Alabama backs received 47th-percentile scores, grading out as eventual average starters, which was an accurate assessment. Zierlein sees McClellan as “an average backup of special-teamer.”
Despite the below-average marks, it is essential to note that Zierlien sees a three-down RB in McClellan, thanks to his size and skill set. The primary concerns are around the lack of upside. Zierlein doesn’t see McLellan as an explosive player.
In his Rookie Scouting Portfolio, Matt Waldman echoed those sentiments. He praised McClellan’s vision and elusiveness as starter-caliber but considered his speed reserve-caliber.
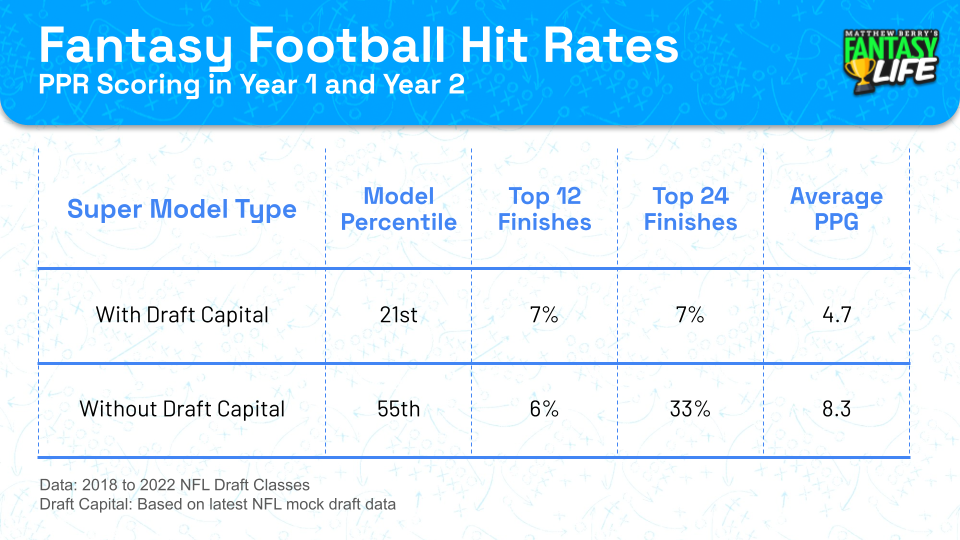
Fantasy Outlook: Hit Rates
- Underdog ADP: Undrafted
- Rookie Dynasty ADP: RB14, Pick 47
McClellan will likely need help from injury or a weak depth chart to earn playing time early in his career. Yet he has the prospect profile that could keep him in the league long enough to seize the opportunity at different points in his career. In a rose-colored glasses scenario, he parlays a few games as a substitute starter into a multi-year role as an early-down option like Robinson.
It is easier to get on board with McClellan in deep dynasty formats where you have time to allow an opportunity to unfold. In formats focused on the 2024 season only, we need a clean landing spot where McClellan can overtake the No. 2 depth chart position to consider drafting him.
Tier 5 – Backup Traits With Low Draft Capital Expectations
We are in the portion of the Super Model where all the prospects project for the 5th percentile or lower draft capital. So, I will highlight the prospects that the Super Model graded similarly to low-end Tier 3 and Tier 4 players without draft capital.
We can revisit these prospects should they go higher than expected in the NFL Draft. In the right landing spot, they could offer RB3 or RB4 potential.
Isaiah Davis | South Dakota State
- RB Super Model: 20th percentile
- Age: 22.8
- Height: 6-foot
- Weight: 218
Prospect Summary
After adjusting for play in the FCS, Davis still offers a production profile on par with Will Shipley and Audric Estime. However, his low-end film grades and lack of pedigree or high-end athleticism and low-end film grades kept him from tallying a more substantial score in the Super Model.
Pedigree and Athleticism
- Program Quality Index: 24th percentile
- NFL Mock Drafts: Round 6
- 247 Recruit Player Rating: 0 of 5 stars (N/A)
- Speed Score Index: 41st percentile
Production and Film
- Adjusted Career YPTA Index: 51st percentile
- Career Total TDs Per Game Index: 47th percentile
- Career Composite PFF Grade Index: 66th percentile
- NFL.com Prospect Grade Index: 38th percentile
Fantasy ADP
- Underdog ADP: Undrafted
- Rookie Dynasty ADP: Undrafted
Kendall Milton | Georgia
- RB Super Model: 18th percentile
- Age: 22.6
- Height: 6-foot-1
- Weight: 225
Prospect Summary
Milton offers a high-end pedigree as one of the most highly recruited RBs of the 2020 class, but he could only carve out a part-time role at Georgia. That hurt his production profile, but part-time work isn’t uncommon at powerhouse programs. He doesn’t offer top-end speed but is a powerful runner capable of adding yards after contact and adding value in short-yardage situations. Milton has the size to contribute to an NFL team as an early-down banger in a committee.
Pedigree and Athleticism
- Program Quality Index: 81st percentile
- NFL Mock Drafts: Round 6
- 247 Recruit Player Rating: 4 of 5 stars (54 overall, RB7)
- Speed Score Index: 38th percentile
Production and Film
- Adjusted Career YPTA Index: 20th percentile
- Career Total TDs Per Game Index: 30th percentile
- Career Composite PFF Grade Index: 46th percentile
- NFL.com Prospect Grade Index: 37th percentile
Fantasy ADP
- Underdog ADP: Undrafted
- Rookie Dynasty ADP: RB17, Pick 51
Dylan Laube | New Hampshire
- RB Super Model: 18th percentile
- Age: 24.7
- Height: 5-foot-10
- Weight: 206
Prospect Summary
No one in the 2024 class offers a higher career target share mark than Laube’s 16%. Even after recalibrating his adjusted career YPTA for FCS play, Laube delivered the top mark in the class at 1.98. He is an older prospect without any pedigree, but passing-game upside is the name of the game for PPR superstardom. Matt Waldman stated Laube is the best route runner in the class and “could develop into an elite receiving threat at the running back position.”
Pedigree and Athleticism
- Program Quality Index: 0th percentile
- NFL Mock Drafts: Round 6
- 247 Recruit Player Rating: 0 of 5 stars (54 overall, RB7)
- Speed Score Index: 34th percentile
Production and Film
- Adjusted Career YPTA Index: 66th percentile
- Career Total TDs Per Game Index: 47th percentile
- Career Composite PFF Grade Index: 81st percentile
- NFL.com Prospect Grade Index: 37th percentile
Fantasy ADP
- Underdog ADP: RB69, Round 18
- Rookie Dynasty ADP: RB11, Pick 40
RB Super Model Inputs & Methodology Overview
Because the model includes advanced data that wasn’t widely available before the 2017 class, our sample focuses on prospects with at least two years of play since then. So, our correlations to future performance currently derive from RB data from 2017 to 2022.
Super Model Note: the only RBs included from the 2017 class left for the NFL after three years because we don’t have data for the 2013 season to cover four-year starters from the class.
For all production stats, the data comes from the game log level rather than the season.
Draft Capital Value
The model uses Chase Stuart’s Draft Value Chart for draft capital, essentially a better version of what many know as the Jimmy Johnson trade chart. The value of a draft pick isn’t linear, and this methodology helps us capture that. The dropoff in value is steeper in the first round and becomes much flatter around the end of the second round. Draft capital value is the most weighted input in the Super Model.
Super Model Note: Because draft capital isn’t linear, the most significant deterioration occurs in the first two rounds. As a byproduct of that, the scores in the model drop off quickly and then begin to flatten toward the end of Round 2. That means the 45th percentile isn’t a bad score – it ranks 20th out of 215 prospects in the database. In fact, 177 out of 215 prospects are below the 35th percentile.
Program Quality Index
Program quality is a pedigree metric that uses draft capital value to determine the total value each collegiate program has contributed to the NFL Draft since 2015. The model uses a composite score derived from two inputs.
- Program draft capital at the RB position
- Program draft capital at the RB, WR and TE positions
Those scores are then indexed to form the Program Quality Index.
Prospects who come from more robust programs score better. Program quality has been a factor in the model before, but this is a better way of quantifying it. Additionally, this metric helps offset lower production numbers from prospects with more competition.
The weighting for pedigree is intentionally lower than the correlation to future production suggests because program quality creates a double-counting effect for draft capital. While we want prospects from schools that churn out high draft picks, that particular player’s draft capital is included in program quality when we look back at the model. This is also why we use a program quality score focused on RB, WR and TE in the RB model.
I want to shout out to Billy Elder, who spawned this idea.
Adjusted Career Yards Per Team Attempt Index
Adjusted career YPTA is a production metric that allows us to normalize yards based on the team environment, which is essential because team volume varies from one situation to the next. A prospect averaging 75 yards per game in a low-volume offense might be better than another averaging 100 yards on a high-volume squad per-team-attempt basis.
Receiving yards are worth twice as much as rushing yards in this equation. This gives us a better approximation of value versus half and full-PPR formats.
Equation: (rushing yards + receiving yards*2) / (team rushing attempts + passing attempts)
Career Composite PFF Grade Index
This qualitative metric is based on a player’s career PFF Rushing Grade and PFF Receiving Grade. If you wonder how PFF Grades work, I recommend reading Steve Palazzolo’s breakdown. But below are two excerpts that can get you by if you just want the basics.
“Credit is given for each move the running back makes to add value to the play, whether forcing a missed tackle, using speed to gain the edge or creating yards through contact.”
“Our goal is to isolate the running back’s contribution to that production, and the runners with the highest grades are those who produce above expectation and outside what the run blocking or scheme allows.”
PFF Grades account for context we otherwise can’t capture at such a massive scale. Because of this, it isn’t surprising that grades correlate more strongly to future production than individual statistics, such as missed tackles forced, yards after contact, and explosive plays. Plus, it allows us to concisely present that information in one data point.
Super Model Note: We are calculating the career grades based on season grades weighted by rushing attempts and passing targets.
NFL.com Prospect Grade Index
This is another qualitative metric based on Lance Zierlien’s prospect grades on NFL.com. His prospect scores have a 0.59 correlation to Year 1 and Year 2 RB fantasy production since 2017, which was strong enough to add a film element to the Super Model.
The grades are indexed on a scale of 0 to 1.
Speed Score
I tested all NFL Combine and pro day data, including RAS (relative athletic scores) for all positions. While most athletic tests show some signal, they aren’t strong enough to make it into the model. However, for RB, Speed Score garnered a 0.31 correlation to future production and offered relatively low overlap with the other data points in the model.
Speed Score combines a player’s weight with 40-yard dash time (weight*200)/(40-time^4), offering a significantly stronger signal over 40 times alone. Bill Barnwell of ESPN created Speed Score.
Career Total TDs Per Game
This is another production metric. The data showed that using a normalized metric like YPTA was superior for receiving yards, but that wasn’t true for TDs. Instead, per-game data demonstrated a stronger correlation than share, per-team attempt, and other options.
There is a correlation between yards and TDs, so once again, there is some overlap in signal between our metrics—however, not all RBs who are strong in YPTA score a lot of TDs.
Age Index
A player’s age derives from how old they will be at the beginning of the upcoming NFL season. Historically, younger players and early-declares carry a stronger signal than older prospects.
Published Updated