2024 TE Rookie Super Model: Tier 3 - The Best TEs in the NFL Draft
Dwain McFarland identifies the top rookie tight end prospects that he classifies in Tier 3 in the 2024 NFL Draft based on data points that correlate most with future NFL production.
Which tight ends in the 2024 NFL Draft have the best chance of producing strongly at the next level?
With the NFL Draft quickly approaching, we are releasing our updated Fantasy Life Rookie Super Model to help answer that question! Last week, we released the WRs, and now we move on to the TE position–where the model has made significant strides since last season.
Our goal is to identify the top rookie prospects based on data points that correlate most with future NFL production. I have been working on NFL rookie models for the last three years, and over that time, I have studied and measured hundreds of predraft variables against future NFL production.
This is a great time to clarify that I am not a mathematician or a coder. Yes, I have a background in data and analytics, but I am self-taught. I didn’t take a course or go to a university to study these topics. I simply love data, understanding why things work the way they do and football.
Okay, back to the point I was about to make before my disclaimer.
The truth is that most variables don’t carry a strong signal, or they overlap too much with an existing variable to make it into a model. Even once you define a list of relatively strong inputs, it is hard to accurately predict which college athletes will be the best NFL players.
Football is a sport with countless dependencies played by notoriously unpredictable creatures known as human beings. When you add in plain old variance, you can see how this activity can become challenging.
But that is what makes it so interesting, and it fuels me to test new ideas every offseason–and this offseason was a SUPER one for tight ends. I don’t want to go overboard with praise for the model, but let's just say I am very encouraged, given how well it performed against important benchmarks.
Correlations to future fantasy performance:
- Raw NFL Draft Pick: 0.58
- NFL Draft Capital Value: 0.66
- Super Model without Draft Capital: 0.65
- Super Model with Draft Capital: 0.71
So, let’s examine the inputs used for the 2024 TE Super Model and then see how the 2024 NFL Draft prospects fared.
TE Super Model Overview
The inputs below are in order of their correlation to fantasy production in a WR’s first two years in the NFL.
- Projected draft capital (NFL Mock Draft Database)
- Adjusted career receiving yards per team pass attempt
- Collegiate program quality
- Speed score
- Career targeted QB rating
- Age
If you have read the WR Super Model, you will notice that the order is slightly different, and Speed Score replaces career TDs per game.
If you want all the details and reasoning behind the inputs and methodology, they are outlined in the TE Super Model Inputs & Methodology at the bottom of this page.
Find Tiers 1 and 2 of the TE Super Model on Tuesday, April 9.
Tier 3 – Rookie TEs That Can Climb With Improved NFL Draft Capital
Theo Johnson | Penn State
- TE Super Model: 36th percentile
- Age: 23.5
- Height: 6-foot-5
- Weight: 259
Pedigree
- Program Quality Index: 85th percentile
- NFL Mock Drafts: Round 4
- 247 Recruit Player Rating: 4 of 5 stars
Johnson was the No. 3 TE in the nation in the 2020 class — one spot behind Michael Mayer, a 5-star recruit. He scores well in the Program Quality Index thanks to Penn State’s history of churning out Round 2 picks in Mike Gesicki, Pat Freiermuth and Brenton Strange.
Recent mocks have Johnson slipping into Round 4 of the NFL Draft, but he could still sneak into Round 3. He possesses the rare size-speed combination teams covet. Thanks to an outstanding NFL Combine performance, he posted a 9.93 RAS — the ninth-best score for a TE since 1987.
Production and Athleticism
- Adjusted Career RYPTPA Index: 24th percentile
- Career Targeted QB Rating Index: 81st percentile
- Speed Score Index: 81st percentile
While the Penn State pedigree boosted Johnson's model score, his Adjusted Career RYPTPA came in below Freiermuth (59th percentile) and Gesicki (42nd). Johnson’s highest RYPTPA mark was 0.97 in his third season at 22.
After adjusting for aDOT, passer rating and teammate competition for targets, Johnson only saw his Adjusted Career RYPTPA sink lower. He finished below expectations in all those categories, leading to his 24th percentile score.
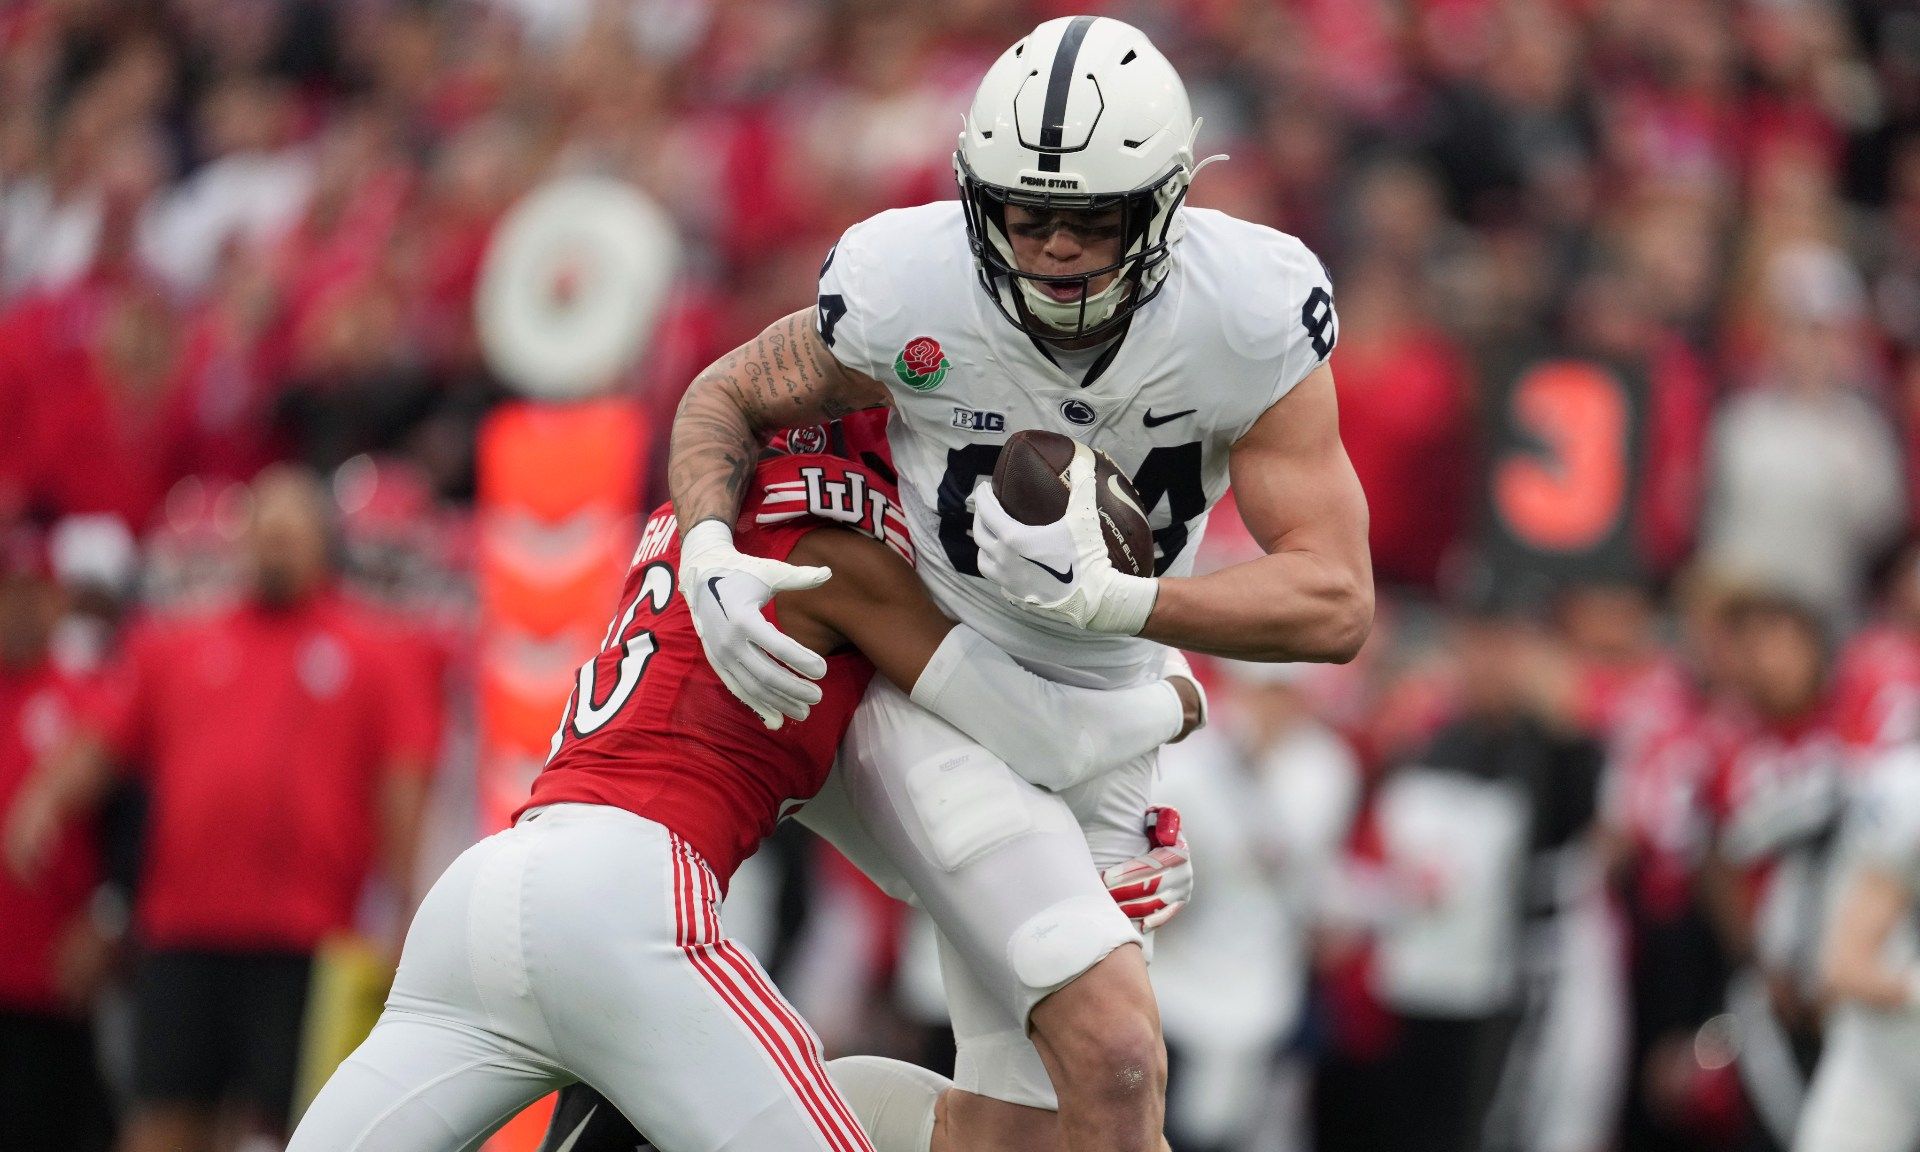
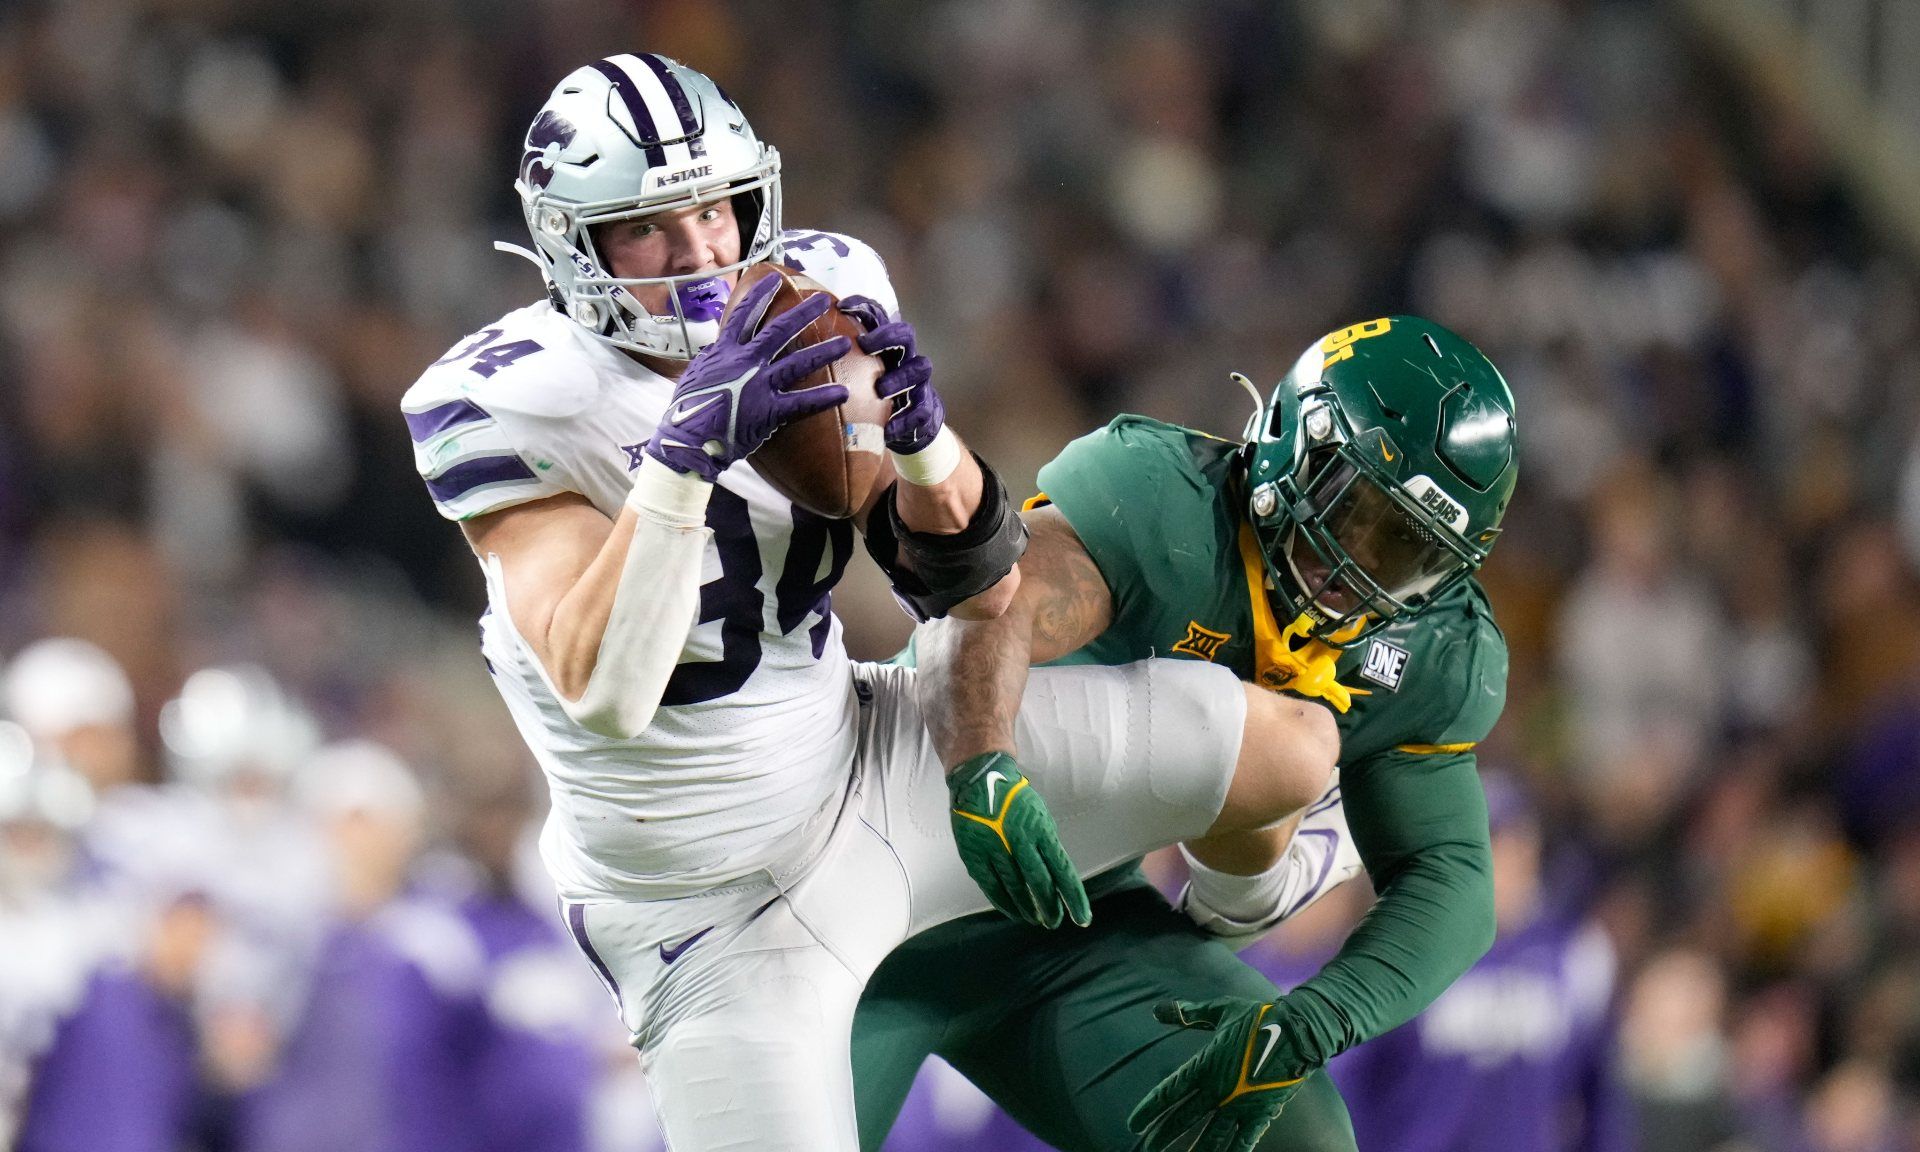
Jan 2, 2023; Pasadena, California, USA; Utah Utes cornerback Zemaiah Vaughn (16) tackles Penn State Nittany Lions tight end Theo Johnson (84) in the first half of the 109th Rose Bowl game at the Rose Bowl. Mandatory Credit: Kirby Lee-USA TODAY Sports
Although Johnson couldn’t carve out a sizable role, he was a plus option when given the opportunity. His QBs registered a 127.6 passer rating when targeting Johnson, good enough for an 81st-percentile finish.
When you pair Johnson’s efficiency when targeted with his 81st-percentile Speed Score, you can see a path for upside in his future. Over the last six drafts, there are four TEs with an Adjusted Career RYPTA Index of 30 or lower and a Speed Score Index of 70 or higher.
- Dawson Knox
- Jelani Woods
- Chigoziem Okonkwo
- Darnell Washington
While none of these players have turned into superstar TEs, Knox was a borderline TE1 in a full-time role before Dalton Kincaid arrived, and Okonkwo has flashed, but playing time hasn’t come easy in Tennessee. Woods (injuries) and Washington don’t have a large enough sample to say yet. It is worth noting Johnson’s Career Targeted QB Index was higher than all of these comps — Okonkwo was the next closest at the 64th percentile.
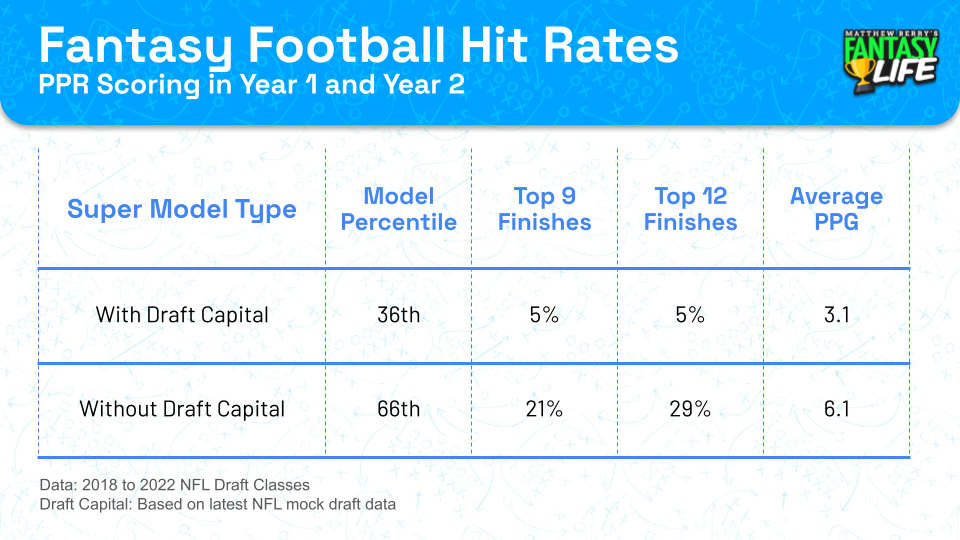
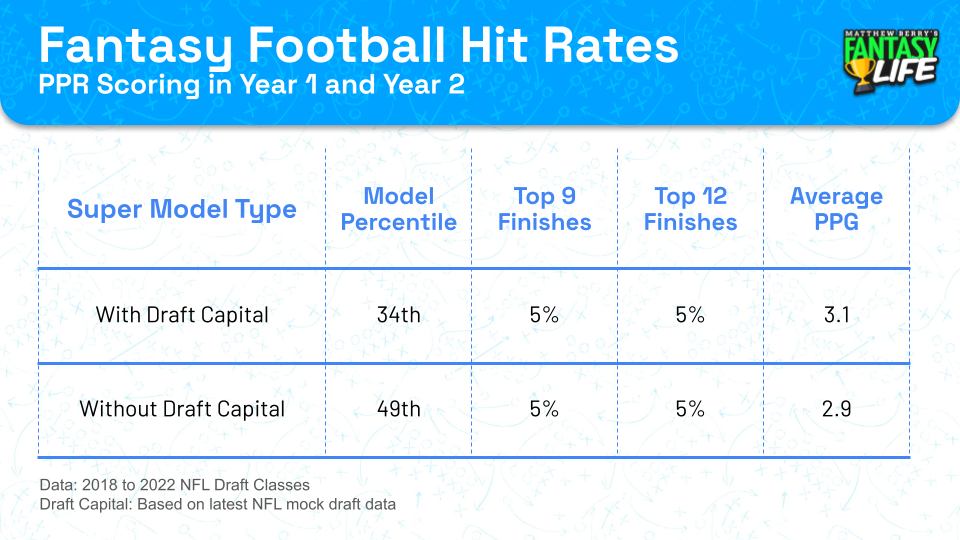
Theo Johnson Fantasy Outlook: Hit Rates
- Underdog ADP: TE39, Final Rounds
- Rookie Dynasty ADP: TE3, Pick 45
When excluding draft capital, Johnson scores well in the model. That means his score will amplify if he goes higher than expected in the NFL Draft.
Cade Stover | Ohio State
- TE Super Model: 34th percentile
- Age: 24.2
- Height: 6-foot-4
- Weight: 247
Pedigree
- Program Quality Index: 70th percentile
- NFL Mock Drafts: Pick 82, Round 3
- 247 Recruit Player Rating: 4 of 5 stars
Stover was recruited as an outside linebacker but switched to TE after his freshman year.
Production
- Adjusted Career RYPTPA Index: 24th percentile
- Career Targeted QB Rating Index: 79th percentile
- Speed Score Index: 50th percentile
Stover is a fifth-year senior who didn’t reach a RYPTPA over 1.00 until his final year (1.52), pulling down his Adjusted Career RYPTPA. He could be a late bloomer, considering he didn’t start playing TE until his second year at Ohio State, which means there is a chance the Super Model is being too hard on him.
Lance Zierlein described Stover's improvement as a receiver “hard to ignore” and compared him to Jake Ferguson. In the Rookie Scouting Portfolio, Matt Waldman noted Stover could take up to three years to develop, but he would have been the TE1 in some previous classes in his process. That caught my attention, considering the rigor Waldman places around his process.
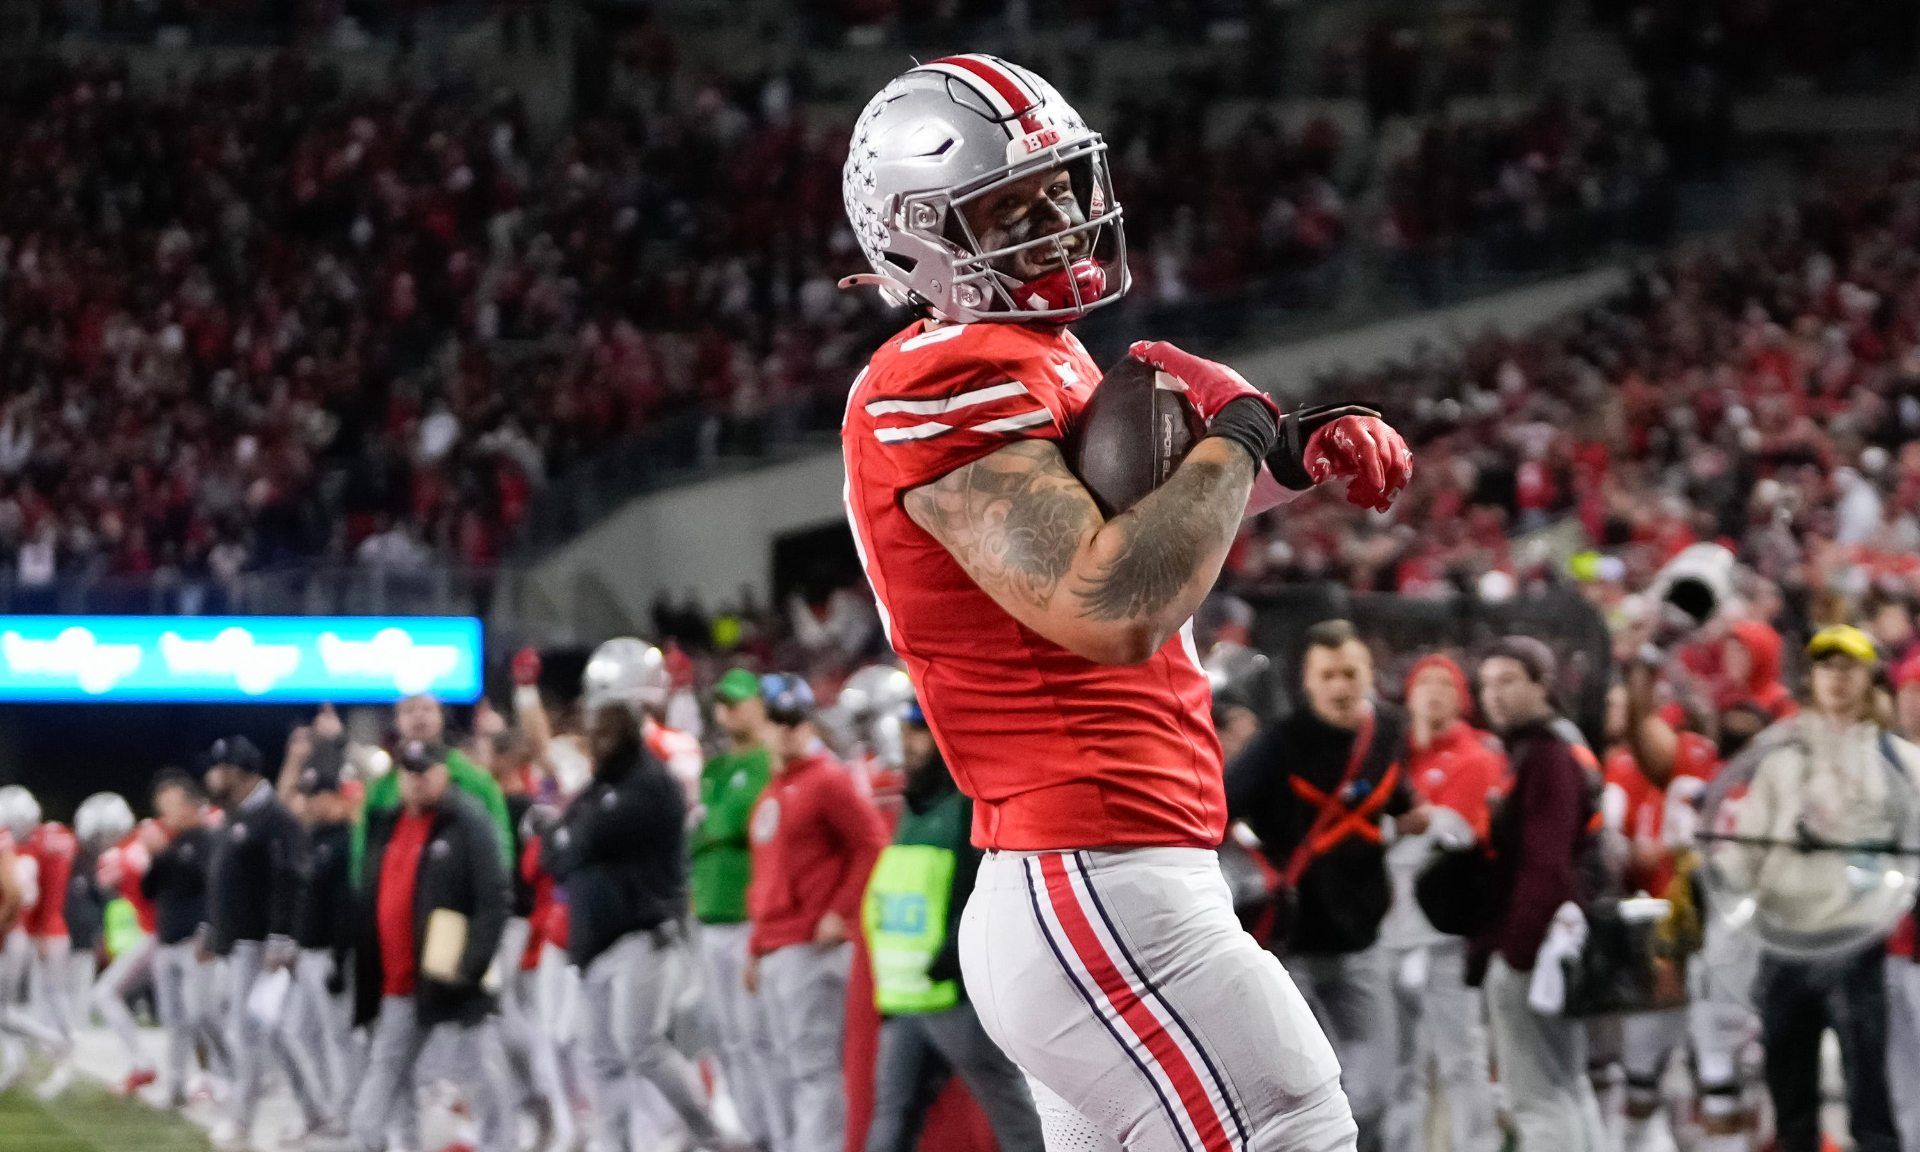
Nov 18, 2023; Columbus, Ohio, USA; Ohio State Buckeyes tight end Cade Stover (8) catches a touchdown pass during the second half of the NCAA football game against the Minnesota Golden Gophers at Ohio Stadium. Ohio State won 37-3.
Stover’s target competition was as tough as it gets. During his time with the Buckeyes, he played with multiple future first-round WRs. After accounting for his teammates (four first-round WRs), Stover finished his career with a 0.14 RYPTA over expected.
Ohio State QBs notched a 127.6 passer rating when they set their sites on Stover. When given the opportunity, Stover stepped up, helping his grade in the model. However, he was not a high-end TD producer, finishing his career at the 21st percentile.
Cade Stover Fantasy Outlook: Hit Rates
- Underdog ADP: TE46, Final Rounds
- Rookie Dynasty ADP: TE6, Pick 52
Like the rest of Tier 3, Stover is a long shot to provide any fantasy value, especially early in his career. The hit rates for his profile in the first two seasons are minimal, but they aren’t 0%.
Ben Sinnott | Kansas State
- TE Super Model: 29th percentile
- Age: 22.2
- Height: 6-foot-4
- Weight: 250
Pedigree
- Program Quality Index: 0th percentile
- NFL Mock Drafts: Round 4
- 247 Recruit Player Rating: 0 of 5 stars
Sinnott, a walk-on at Kansas State, now has a chance to be a mid-round NFL Draft selection.
Production and Athleticism
- Adjusted Career RYPTPA Index: 51st percentile
- Career Targeted QB Rating Index: 70th percentile
- Speed Score Index: 47th percentile
If production is your thing, Sinnott is the prospect to target in Tier 3. His 51st percentile Adjusted Career RYPTA morphs that of Johnson and Stover. As a 20-year-old true sophomore, Sinnott pushed his way into a starting role, posting a 74% route participation. He never enjoyed an elite RYPTPA season, but his 1.69 mark as a junior was the second-highest in the 2024 class behind Bowers (2.06).
Sinnott ranks behind Stover and Johnson in targeted QB rating, but his 70th-percentile index is still high quality. Matt Waldman had this to say about Sinnott after the catch:
“After the catch, Sinnott wins versus every form of contact from defensive backs and off-ball linebackers and often forces gang tackling to bring him to the ground. The thing that stood out most about Sinnott is that he’s one of those players who takes a hit, and the hit doesn’t look as hard as it is. It’s like he’s a marshmallow on the surface with an iron core.”
Nov 12, 2022; Waco, Texas, USA; Kansas State Wildcats tight end Ben Sinnott (34) catches the ball as Baylor Bears linebacker Jackie Marshall (35) defends during the first half at McLane Stadium. Mandatory Credit: Chris Jones-USA TODAY Sports
Had Sinnott smashed the NFL Combine with a faster 40-yard dash than his 4.68, he might have risen draft boards. His 47th-percentile Speed Score could hurt him on many of the team’s draft boards. However, checking off both production boxes and falling short in athletic testing isn’t a game-ender for the former walk-on.
After removing pedigree from the equation, Charlie Kolar, Kylen Granson and Pat Freiermuth compare favorably to Sinnott’s profile. I think that is a fair comparison group that paints a picture of the range of outcomes. The key for his profile is finding his way into an offense that offers a higher ceiling than 40% to 60% route participation, which haunts many similar “F” position profiles. Freiermuth has had stretches as a full-time option and flashed TE1 upside when healthy.
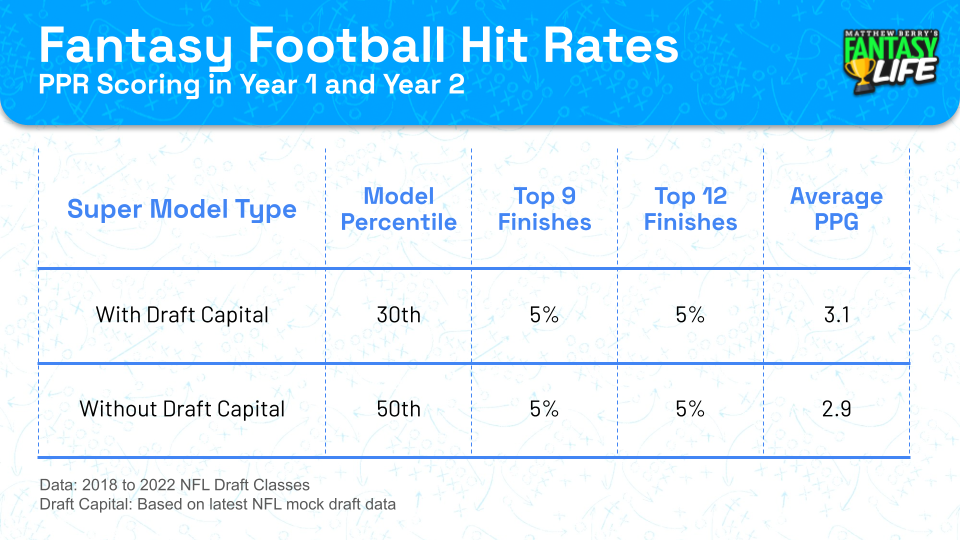
Ben Sinnott Fantasy Outlook: Hit Rates
- Underdog ADP: TE38, Final Round
- Rookie Dynasty ADP: TE4, Pick 46
The table below won’t inspire many of you to take a swing on Sinnott, which is fair in redraft. He would need a clean landing spot with an innovative play-caller willing to keep him on the field, which isn’t an easy runout to achieve. However, he has taxi-squad appeal in deep dynasty formats — especially TE-premium scoring leagues.
Erick All | Iowa
- TE Super Model: 28th percentile
- Age: 24.0
- Height: 6-foot-4
- Weight: 252
Pedigree
- Program Quality Index: 100th percentile
- NFL Mock Drafts: Round 4
- 247 Recruit Player Rating: 4 of 5 stars
All played four seasons for Michigan and transferred to Iowa for his final season. All is getting credit for playing at Iowa with a 100th percentile Program Quality Index. I may tweak this in next year’s model to create a blend between the recruiting school and the final.
Production
- Adjusted Career RYPTPA Index: 33rd percentile
- Career Targeted QB Rating Index: 55th percentile
- Speed Score Index: 44th percentile*
All battled a litany of injuries over his career, including a season-ending back injury three games into his fourth year and an ACL tear in game seven of his final season. He played only 13 games once, thanks to a COVID-19 season mixed in.
When you combine all those puzzle pieces, the missing pieces make it hard to know what you are looking at, and the model sees All as a player who never put it together from an Adjusted Career RYPTPA standpoint (33rd percentile).
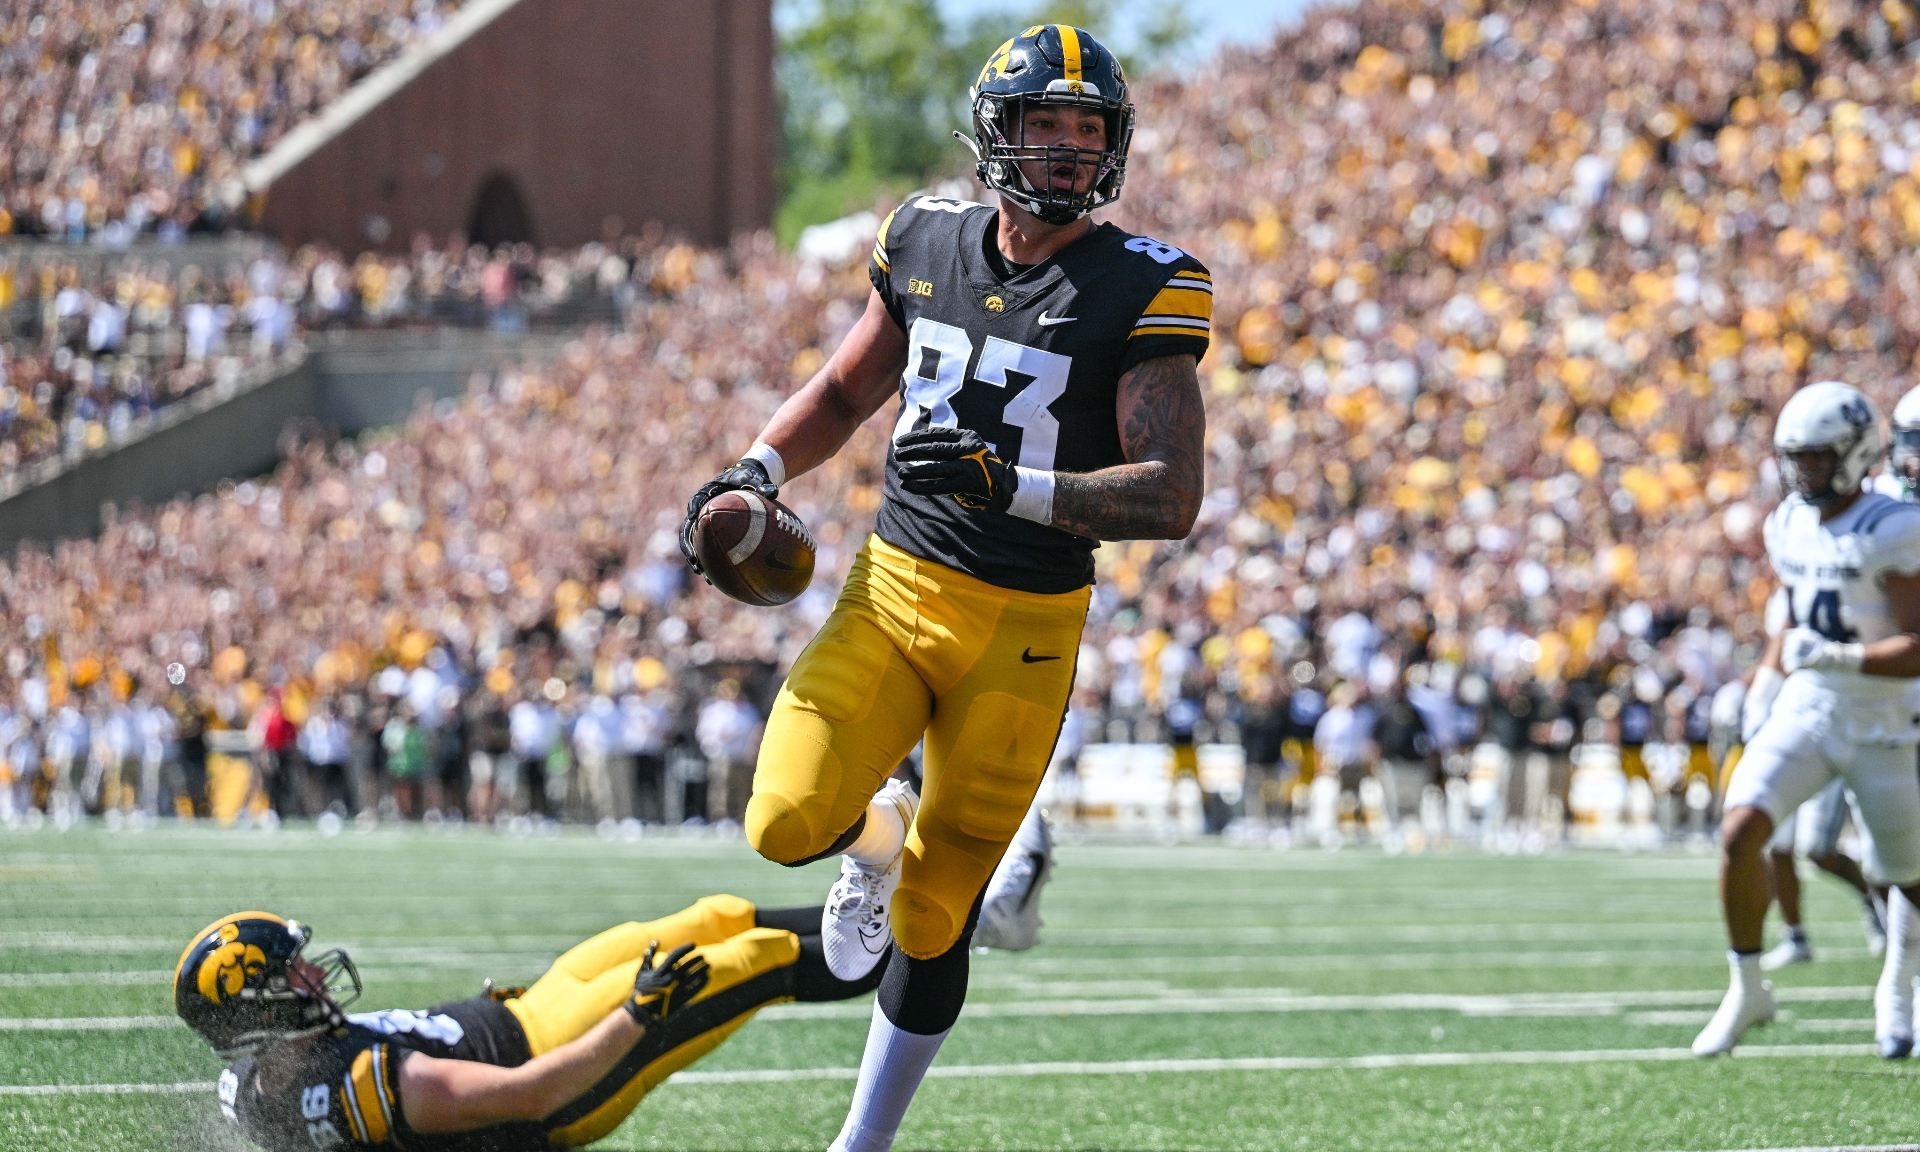
Sep 2, 2023; Iowa City, Iowa, USA; Iowa Hawkeyes tight end Erick All (83) scores on a touchdown pass as tight end Steven Stilianos (86) lay on the turf during the first quarter against the Utah State Aggies at Kinnick Stadium. Mandatory Credit: Jeffrey Becker-USA TODAY Sports
Although YPRR isn’t a component in the model due to its overlap with RYPTPA, this is an excellent example of a sensible use case because it helps us cut through the injuries to just focus on when the prospect was on the field. All’s Adjusted Career YPRR ranked in the 57th percentile — the second-best score behind Bowers.
Furthermore, All’s man and zone coverage data offers us insight into an impressive aspect of his game. By TE standards, All dominated, registering a 25% TPRR against both coverage types. Those marks were eight and 10 percentage points above the average, and no other prospect in the class was better — not even Bowers.
Durability issues could cause the former four-star recruit to tumble down NFL Draft boards, but, if healthy, he offers a unique profile at a discount.
Erick All Fantasy Outlook: Hit Rates
- Underdog ADP: TE64, Undrafted
- Rookie Dynasty ADP: TE7, Pick 56

TE Super Model Inputs & Methodology Overview
Because the model includes advanced data that isn’t widely available before the 2018 class, our sample focuses on prospects with at least two years of play since then. So, our correlations to future performance currently derive from TE data from 2018 to 2022.
For all production stats, the data comes from the game log level rather than the season.
Draft Capital Value
The model uses Chase Stuart’s Draft Value Chart for draft capital, essentially a better version of what many know as the Jimmy Johnson trade chart. The value of a draft pick isn’t linear, and this methodology helps us capture that. The dropoff in value is steeper in the first round and becomes much flatter around the end of the second round. Draft capital value is the most weighted input in the Super Model.
Adjusted Career Receiving Yards Per Team Pass Attempt Index
Yeah, that is a mouthful, huh? To help, we will shorten receiving yards per team pass attempt to RYPTPA, an acronym you will see throughout this piece. If you have a cooler name for us to use, don’t hesitate to DM me on X.
RYPTPA helps us normalize receiving yards based on the team environment, which is very important because how much college teams pass the ball varies drastically from one situation to the next. A prospect averaging 75 yards per game on a run-first offense might be better than another averaging 100 yards on a run-first squad on a per-team pass attempt basis.
The adjusted version of Career RYPTPA accounts for four critical variables that showed to impact performance:
- Age and class (i.e., first-year, second-year student, etc.)
- Average depth of target (aDOT) and alignment
- Team passer rating
- Teammate score (competition for targets)
Tight ends who performed well in RYPTPA in Years 2 and 3 enjoyed more robust hit rates in their first two years in the pros. While it is more common for TEs to take longer to develop than WRs, many of the best prospects are doing it in a big way by Year 3.
While WRs don’t get much credit for their fourth season, TEs can still impact their score in the model with a strong performance as seniors. However, the fifth year is much more common for TEs, but the correlation to future production was negative.
The model accounts for these nuances by weighting the years in this order: Year 2, Year 3, Year 1, Year 4. It is important to note that the model expects Year 1 to be at age 18 or 19. If the player doesn’t play in those two years, it counts as a redshirt season, and the player gets a zero RYPTPA.
So, years are not always perfectly aligned with a player’s class, but that is OK. We want a measure that allows us to capture the spirit of age and time on campus, and this methodology accomplishes that goal without massive additional data mining.
This measurement also allows us to move away from breakout thresholds, which have a nasty habit of barely missing prospects, a little too low or high — everything is now on a scale.
The other three variables quantify an expected RYPTPA based on game-level data since 2014. Then, we can perform an over-expected calculation.
- The higher a prospect’s aDOT, the higher their expected RYPTPA.
- The higher a team’s passer rating, the higher their expected RYPTPA.
- The stronger the teammate competition, the lower the player’s expected RYPTPA.
These four factors are then weighted and combined into one data point and indexed (placed on a scale from zero to one).
Program Quality Index
Program quality uses the draft capital value to determine the total value each collegiate program has contributed to the NFL Draft at the TE position since 2014. Those scores are then indexed to form the Program Quality Index.
Prospects who come from stronger programs score better. Program quality has been a factor in the model before, but this is a better way of quantifying it. Additionally, this metric helps offset lower production numbers from prospects with more target competition.
I want to shout out to Billy Elder, who spawned this idea.
Speed Score
I tested all NFL Combine and pro day data, including RAS (relative athletic scores) for all positions. While most athletic tests show some signal, they aren’t strong enough to make it into the model. However, for TE, Speed Score garnered a 0.34 correlation to future production and offered relatively low overlap with the other data points in the model.
Speed Score combines a player’s weight with 40-yard dash time (weight*200)/(40-time^4), offering a significantly stronger signal over 40 times alone. Bill Barnwell of ESPN created Speed Score.
Career Targeted QB Rating Index
This metric tells us the passer rating when a prospect was targeted. There is an inherent overlap between targeted QB rating and RYPTPA data points because both use yards.
However, RYPTPA tells us how a player performed in the context of their team, while targeted QB rating tells us how well a prospect performed when targeted. That critical distinction allows these two metrics to work well together.
Note: YPRR correlated more strongly to future performance than targeted QB rating and was in consideration. However, its overlap with RYPTA was high. The correlation was 0.82, while the targeted QB rating was 0.38. That made targeted QB rating a superior option for the opportunity-context data point in the model (RYPTPA is a team context stat). The lower correlation between the two makes sense because targeted QB rating accounts for completions, incompletions, TDs and INTs, adding breadth to our view of the prospect.
I want to shout out to Peter Howard, the first person I noticed using targeted QB rating in their model.
Age Index
A player’s age derives from how old they will be at the beginning of the upcoming NFL season. It doesn’t carry as much weight in the TE model as it used to because we already account for age in adjusted career RYPTPA.
You will notice that the dominator rating, which combines a player’s percentage of yards and TDs, is no longer in the model. Career total TDs and RYPTPA offered stronger correlations to future production, and the dominator rating was duplicative, so it didn’t make sense to keep it in the model moving forward.
You might also be wondering why target share wasn’t included–especially considering how important it is at the NFL level. The answer is twofold: 1) RYPTPA is stronger, and the two correlate strongly. 2) The targeted QB rating was stronger and offered a holistic view of efficiency that we can’t get from target share, which made it a better pairing with RYPTPA.
Published Updated