NFL Playoff Power Rankings: Conference Championship Round
Our ELO model takes the whole season into its calculation. So, late-season changes may not drag the team’s average down.
So, here we are. The final four are gearing up for the conference championships, and each team looks like a contender. We didn’t get any upsets. There are no flukes with two games left before the Super Bowl. And, honestly, this feels right.
We’ve been using the ELO model over the last couple of weeks to hone in on the better teams. Minnesota looked more like a pretender for the Wild Card Round after diving into the model, and the 49ers’ defense highlighted on Sunday why an “overrated” label simply doesn’t apply to them. But with four teams left, I took a quick look back at how the models worked out and if we missed anything when evaluating these thrilling playoff matches.
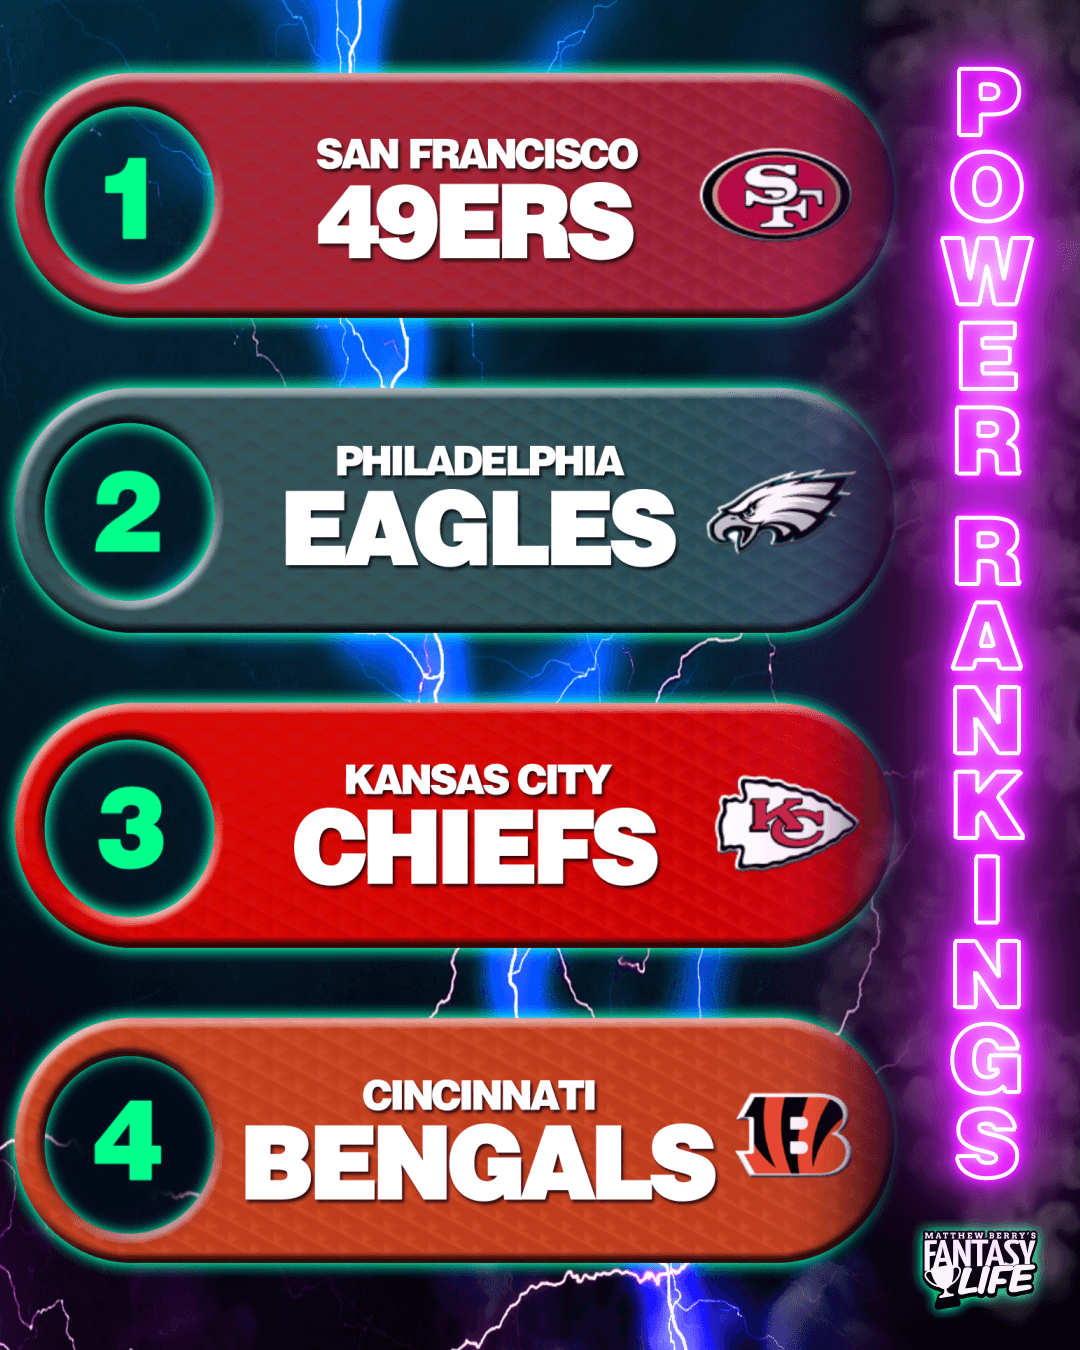
Fantasy Life's Conference Championship Round Power Rankings
Hits and Misses
The Model Tried to Tell Us
Let’s go back a couple of weeks to the Wild Card Round. The Eagles and Chiefs had their byes locked up, but their season-long victories gave us an initial top-five from the ELO model worth remembering.
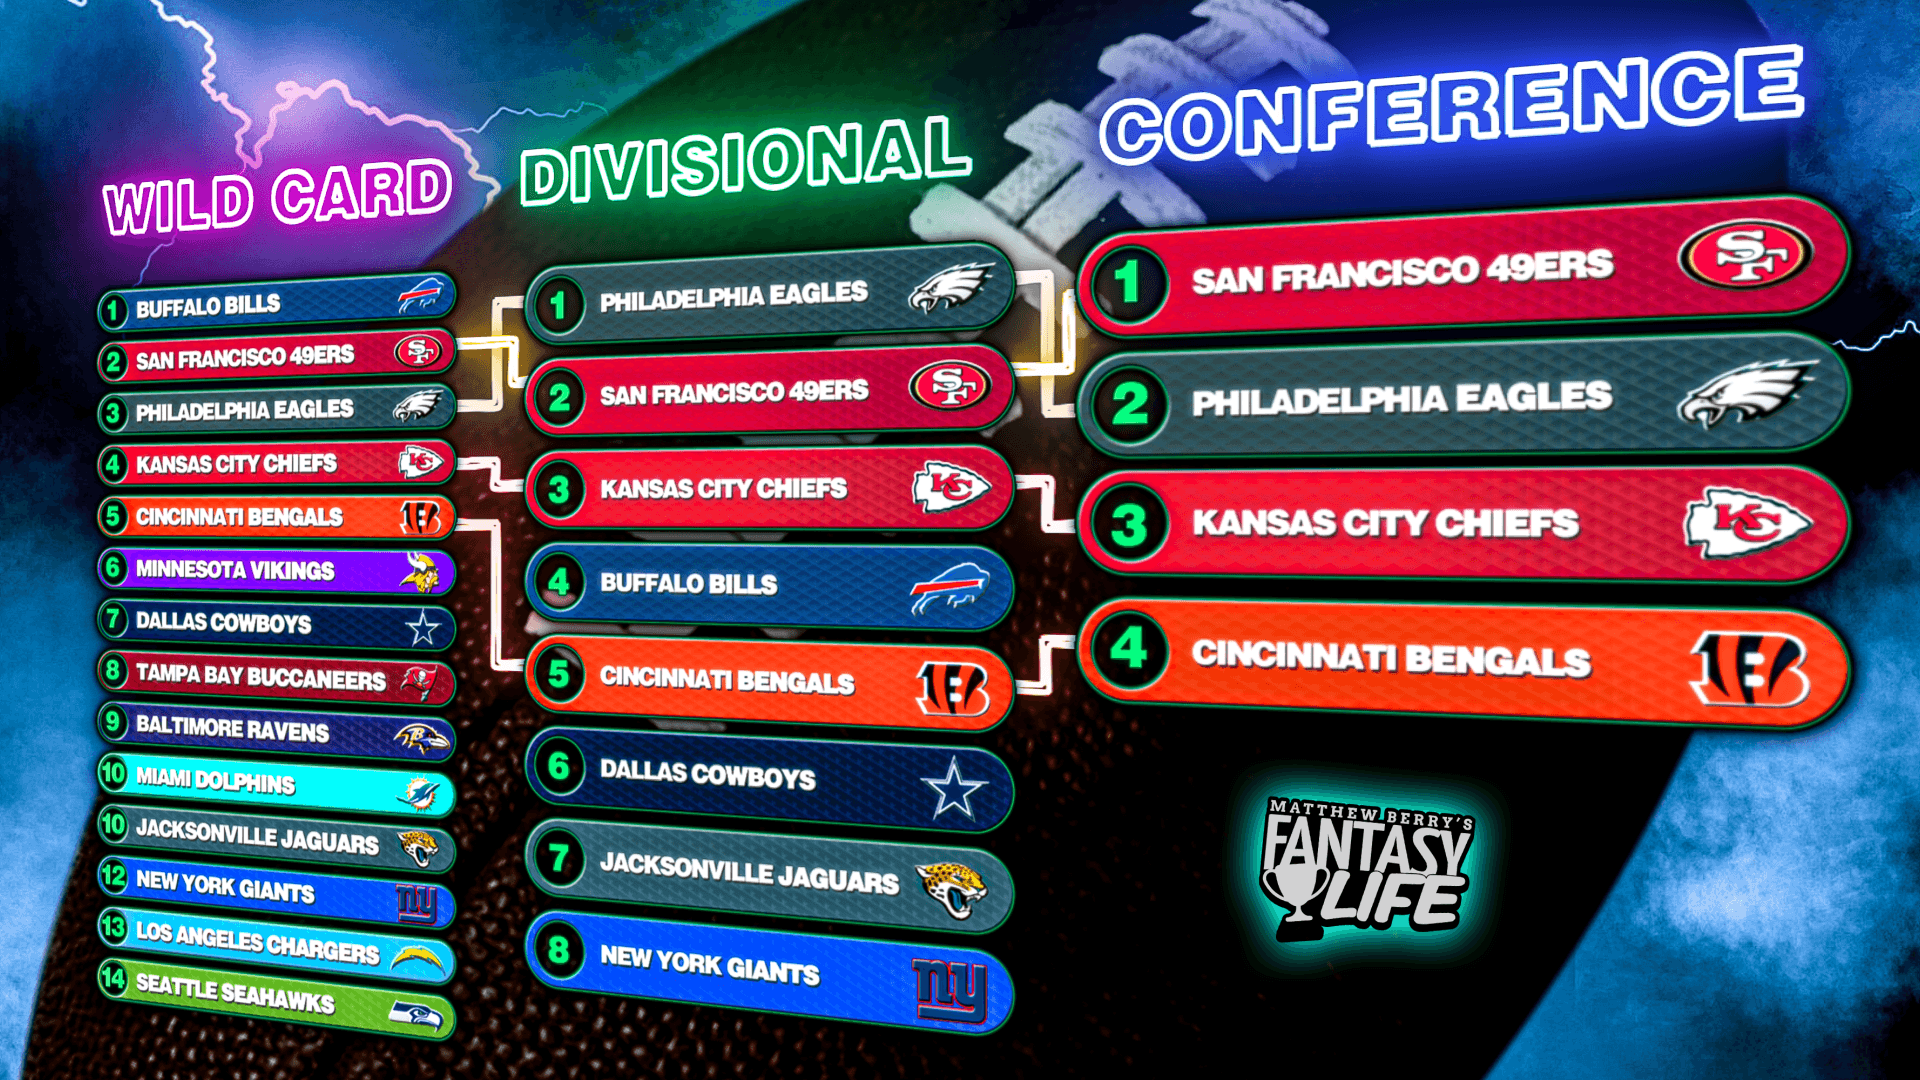
Some familiar teams on that list! I’ll get to Buffalo’s demise in a bit, but the model had this group as the top tier heading into the playoffs. And hindsight being 20/20, this makes sense. Because while the ranks relied on adjusting wins based on opponent and point differential, two separate lists pointed us to a similar conclusion.
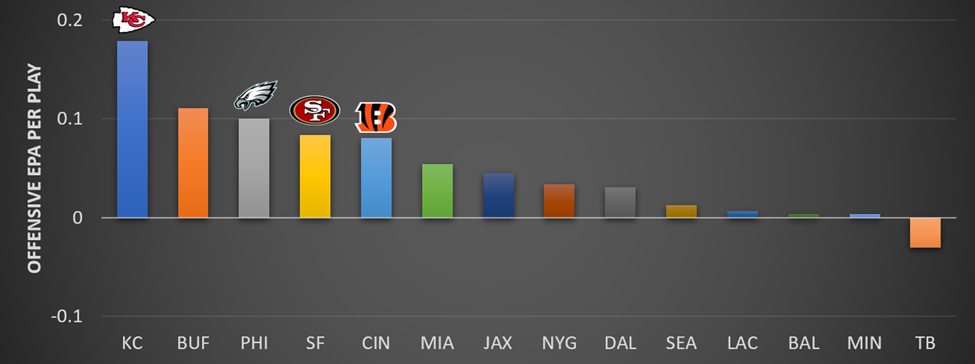
They’re in a different order, but the same group made up the top five in regular-season offensive EPA per play. Despite San Francisco narrowly missing the cut, we see our final crop of squads toward the top in total DVOA. A missed opportunity or a different decision may have swung one matchup, but this week’s output from the model aligns with everything we watched over the weekend.
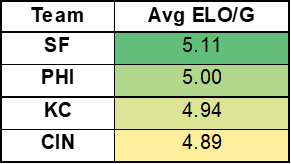
The league’s best teams are fighting for the championship. Cincinnati’s double-digit win over the Bills pulled them into the top four in average ELO per game. Even if Buffalo had won, we’d interpret the model similarly, given each squad’s average ELO per game. However, some nuance still became a larger factor on Sunday afternoon.
The Human Element of the Game
The ELO model had Sunday afternoon’s matchup as a tight race. Both teams seemed evenly matched, with the Bills ranked fourth and Cincinnati right behind them, but the results couldn’t be more different.
It’s not that Josh Allen’s -0.09 EPA per attempt on Sunday was his worst performance of the season. It wasn’t. His low point was in Week 9 against the Jets.
Two of his five worst games by EPA have come in the last two weeks. I raised my eyebrow after the Wild Card Round and gave him the benefit of the doubt. He’s Superman. But maybe the Bills just needed Clark Kent.
Full disclosure: I’m a Bengals fan, so I bought into the pre-game hype. Of course, I’m happy with the boxscore, but Allen’s superhero tendencies weren’t something the model (nor I) could take into account. Twenty of his 81 attempts in the playoffs have been 20 or more air yards. Some were game script related. Others highlight his inability to rely on his playmakers outside of Stefon Diggs.

Even with longer down and distance scenarios, Joe Burrow knew how to leverage his personnel in pure passing situations. As a result, the Bills have a bit of soul-searching to do over the offseason. The model won’t capture all the edges of each team, but the playoffs will expose every team’s greatest weakness.
Bengals On the Rise
After the win against the Ravens, this tweet accurately encapsulated the vibes around Cincinnati.
The Bengals came into the match with concerns around their offense. As I said earlier, in the aggregate, their regular-season output had them at fifth in EPA per play. But their division rival had their number, and the loss of LT Jonah Williams hollowed out their victory.
So a trip to Orchard Park felt like a tall order. Vegas certainly thought so. However, the offense played as if the prior week didn’t happen.
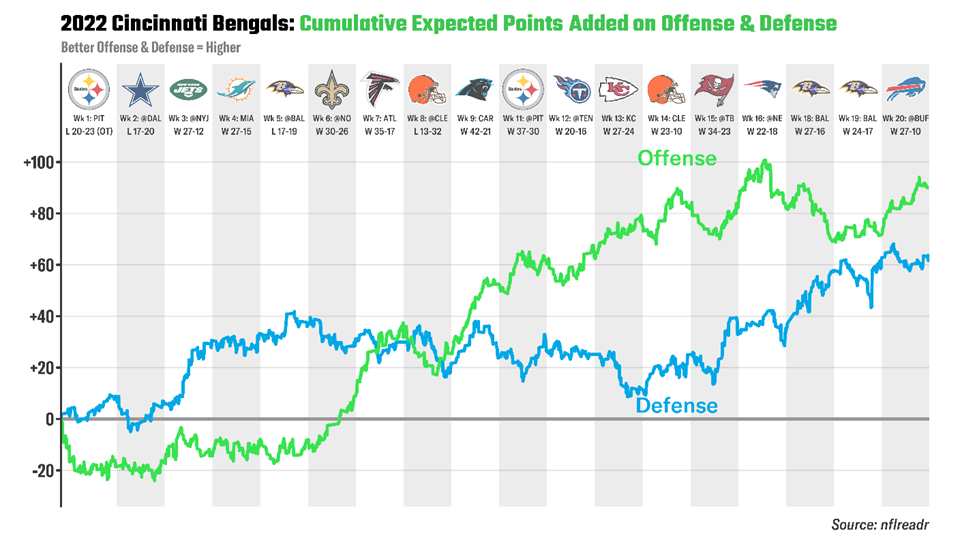
Cincinnati averaged an absurd 54.9 yards per drive. They punted twice all game. Five of their eight offensive series resulted in points. We knew the offensive line would be an issue, but Zac Taylor and OC Brian Callahan knew how to set up their backups for success. Buffalo pressured Joe Burrow on 30.8% of his dropbacks, the fourth-lowest rate in the Divisional Round. And, of course, Joe Cool delivered even under duress.
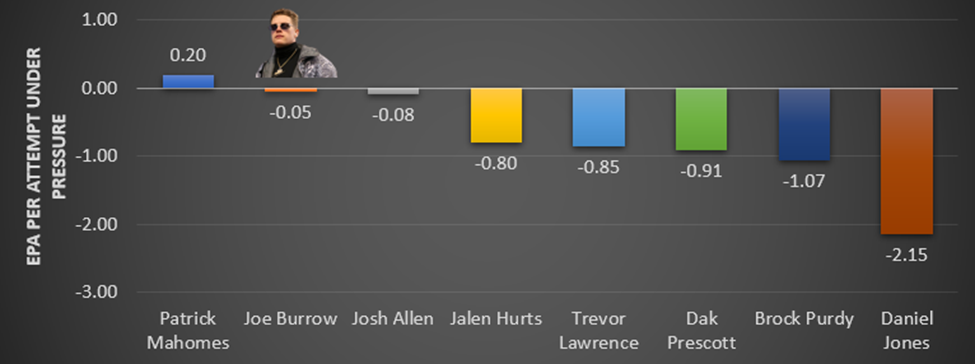
Burrow was second in EPA per attempt on the 12 dropbacks Buffalo got through the line. One resulted in the game's first touchdown, and the third-year passer led all starters in adjusted completion percentage under pressure. But he’s shown us he can be a top-5 quarterback all season, so I was less worried about the passing game. My concerns were with the running game, but those disappeared into the snow midway through the matchup.
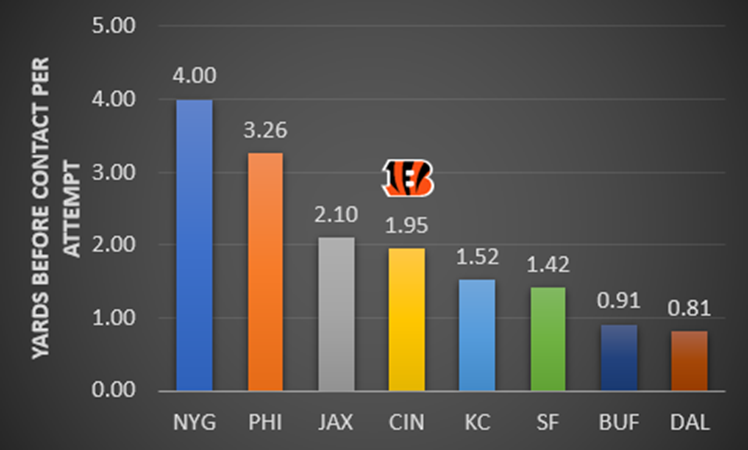
Joe Mixon averaged 1.13 yards before contact per attempt since Week 16, after La’el Collins went down and O-Line injuries cascaded to the other starters. It nearly doubled against the Bills. He did have four explosive plays, but Mixon wasn’t reliant on the big plays. Six of his 20 runs were chunk gains (between 5 and 10 yards), keeping second and third downs more manageable. As Cincinnati heads towards its second-consecutive AFC Championship Game, there shouldn’t be much doubt about how much they’ve improved since their last trip to Kansas City.
But even a hobbled Patrick Mahomes is a dangerous one. Allen missed a few intermediate shots that could have kept the Bills driving. I expect Mahomes to capitalize on similar looks this weekend. But I’m also confident the Bengals will know how to respond.
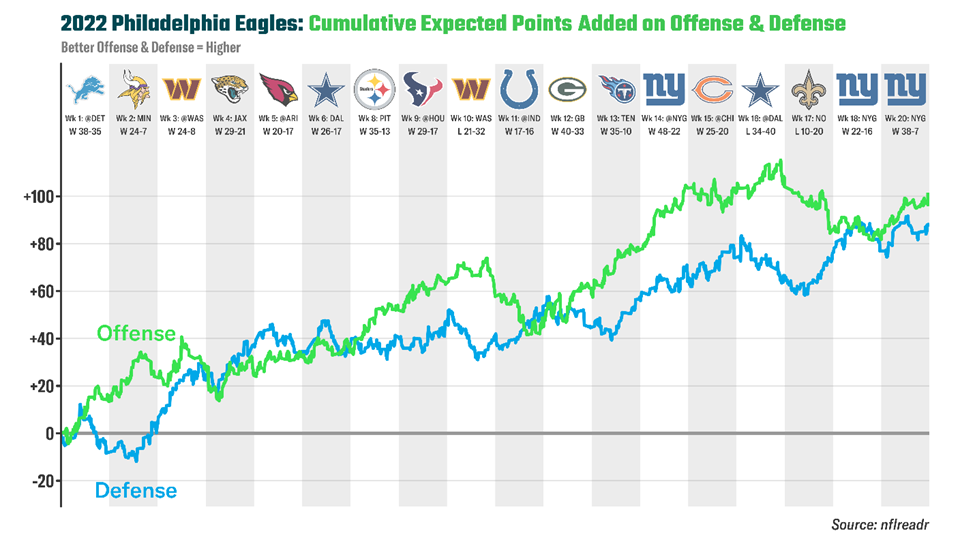
How Did the Eagles Fall?
First, if you’re an Eagles fan, let’s all just agree that a win is a win. Your team got the first-round bye, handily beat the Giants, and are 2.5-point home favorites against the 49ers. You couldn’t ask for a better runout. But last week’s matchup is the obvious reason for the slide in the ranks.

Philadelphia dominated the game from start to finish. Their first punt didn’t come until the end of the first quarter but by then, they had already scored two touchdowns. After the first quarter, the Eagles’ touchdown count (2) was greater than New York’s first-down total. The Giants put on a good show back in Week 18, which gave me some pause about a potential upset. But the bye week was just what Jalen Hurts needed to get the offense back on track.
In the regular season finale, Hurts had five designed rushes out of his nine attempts. He was fresh off his two-week absence and getting back in sync with his receivers was critical. And on Saturday, his designed rush rate was up to 88.9%. So Hurts, the rusher, was undeniably back in action for the Divisional Round. Plus Hurts, the passer, didn’t look so bad either.

I looked at the month before his shoulder injury to establish a baseline. He’s still problematic as a passer if his protection breaks down, but his scrambling ability (100% success rate on scrambles in the win over the Giants) can keep the Eagles ahead of the sticks. More importantly, his rhythm in the quick game has improved since his return.
Against San Francisco, Dallas intended to get the ball out of Dak Prescott’s hands as quickly as possible. Half of his throws came out in less than 2.5 seconds per PFF. Of course, the interceptions ruined their comeback chances, and his short throws only averaged 4.4 yards per attempt. Hurts had a bit more success on his quick throws, and the Eagles' running game can keep the 49ers’ pass rush in check. Regardless of the outcome, the ELO model emphasized who the best teams are for this weekend.
Published Updated