What is Expected Points Added (EPA) in Fantasy Football and Sports Betting?
Chris Allen explains how EPA is calculated and how to apply this metric to fantasy football and sports betting.
What is EPA in Fantasy Football and Sports Betting?
EPA stands for expected points added, which is a metric that gives us a play-by-play measure of a team’s success. In real time, we qualitatively evaluate results based on vibes and call it momentum. Every positive play “feels like” it sets up the next, while a dropped pass or loss of yardage appears devastating. EPA quantitatively does the same thing but adds context to the discussion.
For those who didn’t know, I’m an engineer when I’m not slinging takes in my writing. Shocker, right? The guy that shoehorns a chart into every piece of content has a technical background. But my tendency to parse teams and players through the lens of efficiency also shouldn’t be a surprise.
Just like in my breakdown of the pass rate over expected metric (PROE), the “expected” part of expected points added requires some studying. But before I get into a technical history lesson, let’s focus on the metric itself.
What is EPA?
Expected points added (EPA) calculates the relative value of every play based on the expected value before the snap as well as the result. Virgil Carter first proposed assigning “expected point" or EP values to each possession based on field position, and that eventually evolved with additional studies from Brian Burke. So while EPA is an advanced metric, the logical underpinnings are pretty intuitive.
Think about the other metrics we use to characterize offenses. I find yards per game (or per drive, play, etc.) a useful stat when looking for trends. However, the key assumption for yards per game is that every yard, drive, or possession is created equally when they're really not. Let’s pull on that thread a bit using publicly-available data from nflverse.
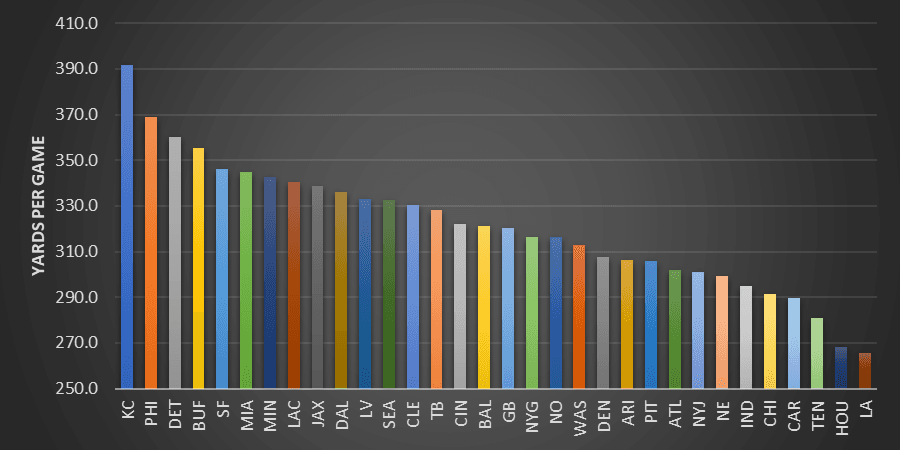
In 2022, the Chiefs led the league in yards per game, and the Eagles, Lions, Bills, and 49ers rounded out the rest of the top five. All five of these teams were offensive juggernauts, so this shouldn't exactly be breaking news.
But here's why yards per game doesn't necessarily capture the whole picture.
As a Bengals fan, I can’t expect Cincinnati to put up points every time Joe Burrow has the ball. If they did, it’d do wonders for my anxiety, but I’m a reasonable guy. I’ll take shots on goal, though.
If the Bengals can consistently accumulate yards on the opposite side of the field, they can tilt the game in their favor. A positive play from the opponent’s 10-yard line is worth more than the same play from the team's own side of the field.
In essence, it’s not just about which team generates the most yards but also where on the field those gains occur.
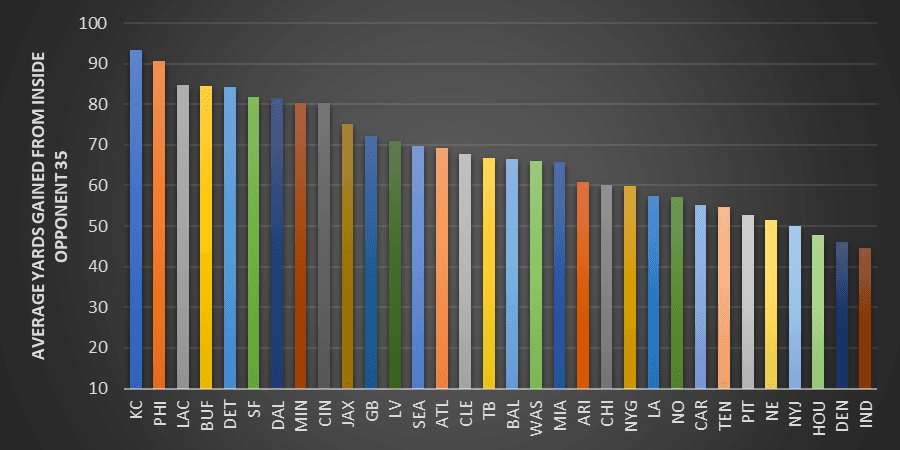
When looking at average yards gained from inside the opponent's 35-yard line, the Chiefs and Eagles remain at the top, but there's a reshuffling of the top 10, and the Bengals (rightfully) make an appearance. Overall, the more impactful teams from 2022 rise to the top.
At a basic level, EPA captures things like this to better quantify each team or player's performance based on the expectations of each play.
This could come in handy when evaluating what teams to stack in best ball on Underdog Fantasy. You can use EPA to your advantage and start drafting today with a 100% deposit match of up to $100 by signing up for Underdog Fantasy below!

Get $25 Guillotine League Credits When You Join FL+
Lorem ipsum dolor sit amet, consectetur adipiscing elit. Nunc tinciedunt, ex sit amet cursus gravida, dui mauris vulputate felis.
How is EPA Calculated?
To understand how EPA is calculated, let’s reuse the field position example from above. We intuitively know that a first down after a touchback isn’t as significant as a goal-line play. Obviously, we all know that scoring potential is greater in the opponent's red zone.
The greater a team’s potential to score, the more value we can assign to each possession. In other words, the closer a team gets to the opposite end zone, the more we can expect their point total to increase. With enhanced modeling efforts, we can calculate expected points (EP) for every play.
EPA is the difference between the EP values of two consecutive plays. The result indicates the relative impact of every snap from a 60-yard bomb to a sack. Positive EPA values indicate success and negative numbers spell disaster.
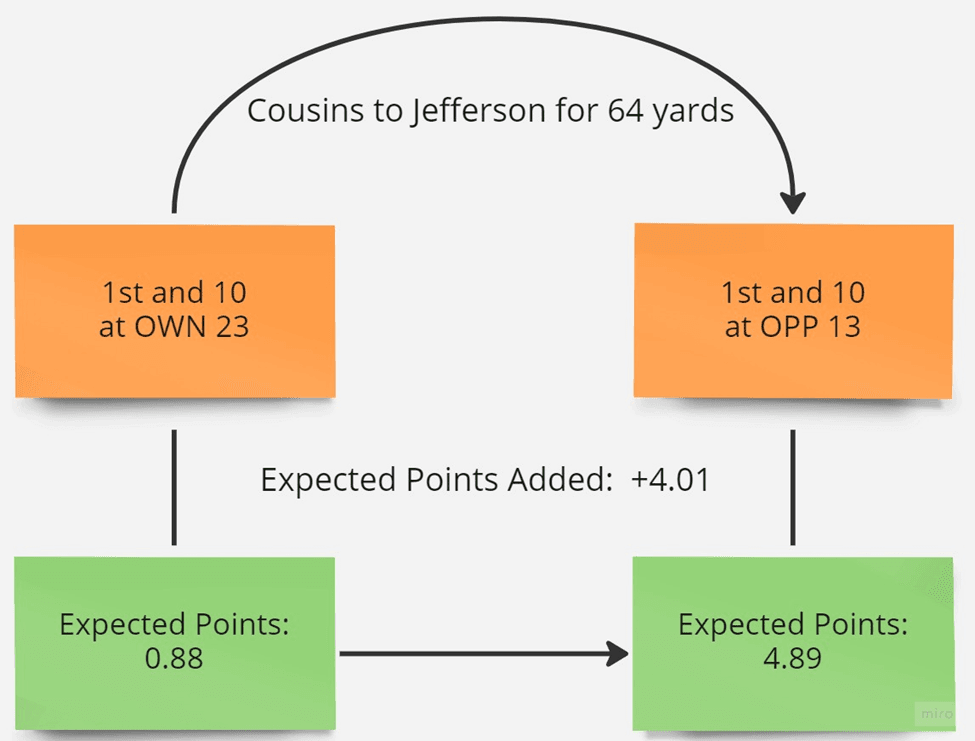
I’ll use a reception by Justin Jefferson from the Vikings' trashing of the Packers from Week 1 of last season as an example.
Green Bay's secondary got the last laugh when these two teams met again in Week 17 of last year, but Jefferson smoked the Packers for 184 receiving yards in Week 1. For this example, go to the 28-second mark of the video from the tweet above.
The Vikings had a first down at their own 23-yard line. Per nflfastR, the possession had an EP of 0.88. Kirk Cousins connected with Jefferson for a 64-yard strike, which then set the Vikings up with a new set of downs at the Packers’ 13-yard line.
With their new field position, the next play’s EP was 4.89. The Cousins-Jefferson connection had an EPA of +4.01 on that one play.
Now let’s revisit Jaire Alexander keeping Jefferson in check to close out the fantasy season. Alexander mocking Jefferson with the Griddy felt especially cold watching it live, and Minnesota’s EPA took the brunt of the slander.
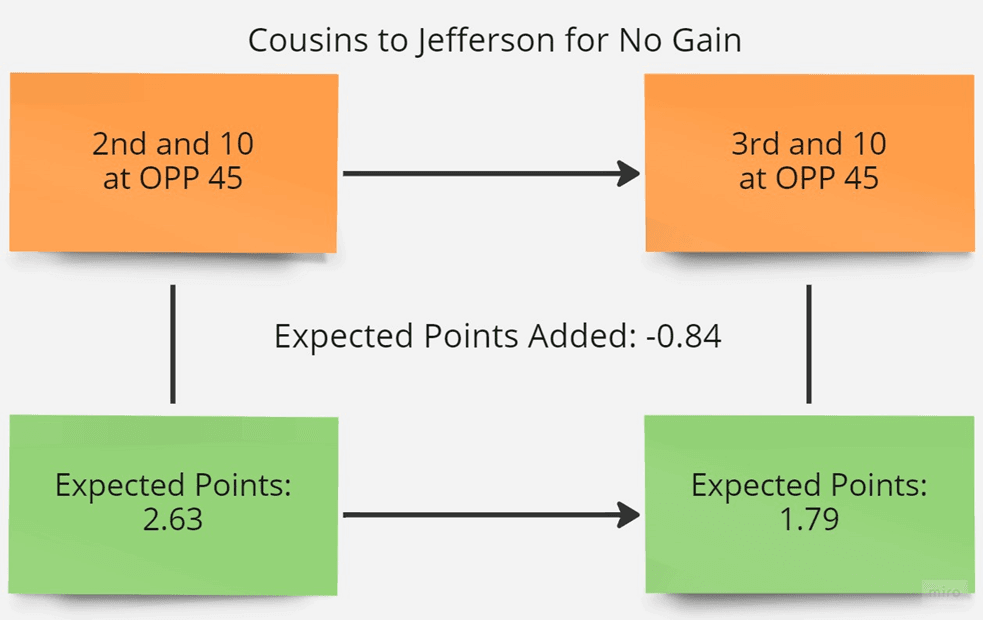
Because this particular play went for no gain on a second down, the Vikings had fewer attempts to score or reset the downs as well as less time left on the game clock overall even though it was still the first quarter.
As a result, Minnesota's EP for the next play fell with a slightly smaller chance to take the lead, producing a negative EPA value of 0.84.
What are Expected Points?
OK, so EPA only requires you to subtract two numbers, which is fairly quick and easy. But now let’s get into the technical part regarding expected points. I’ve highlighted some of the factors, and a 2018 paper on nflWAR provides even more insight, but EP is how we can insert context into the calculation.
EP values use historical data to model the likelihood of a team scoring on any given possession. Successful plays, like the Jefferson catch, increase EP, while defensive plays like Alexander’s pass break-up lower EP.
We already know one of the elements to calculate EP, which is yard line. The closer a team is to the opponent's end zone, the better chance they have to score. That makes sense intuitively, but the data also proves it.
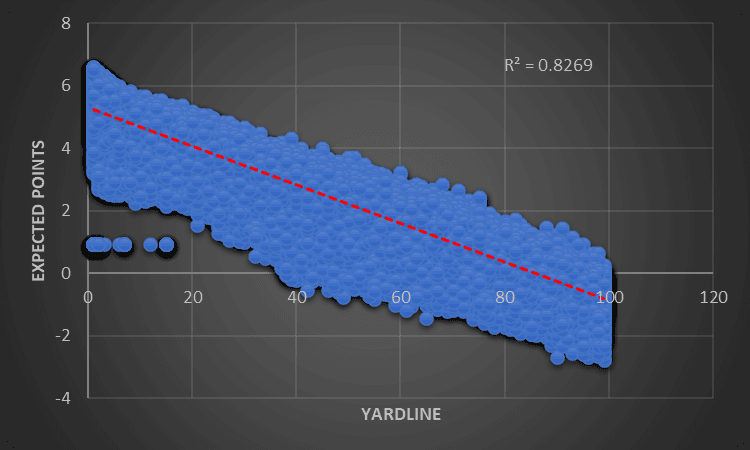
A five-year sample of regular-season offensive plays visualizes what we already knew was true. Distance to the end zone and expected points are highly correlated. With an r-squared value of 0.83, the data agrees with our intuition that field position affects a team’s chance to score. So, let’s use the same logic path.
Consider other in-game features that could help or hurt an offense’s scoring probability. Their number of attempts remaining should play a role.
As the down increases from first to fourth (or third down in many cases), an offensive unit has fewer tries to reset the count, which in turn lowers their scoring prospects. Therefore, EP should decrease as a team creeps toward fourth down.
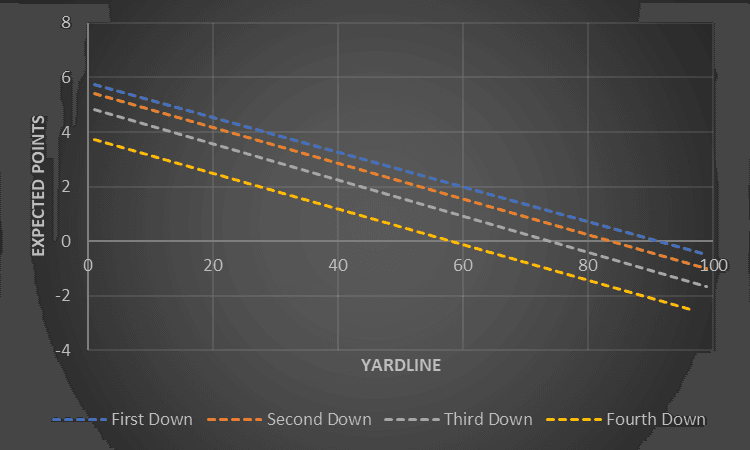
Again, the data shows what was expected. A fourth down is worth less EP than a first down regardless of field position, and the more attempts available in a given set of downs, the greater the odds are of getting into the end zone.
More downs remaining isn't the only factor, either. Teams also benefit from having more time remaining in the game overall. I broke down the first half below as an example.
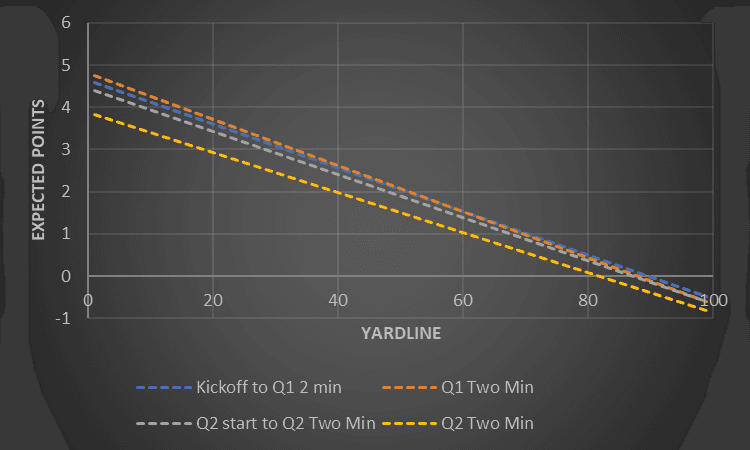
EP is at its highest right after the kickoff. At that point, play callers have the entire game to get into a rhythm, identify what does and doesn’t work, and make adjustments. However, things change during the final two minutes of a half.
PROE spikes in the final two minutes as offenses scurry to protect a lead or close the gap, but they’re up against the clock. With fewer moments to spare, scoring chances are lessened relative to earlier in the half.
Application of EPA
Let’s do a quick review before we continue.
Expected points (EP) are values assigned to each play based on the yard line, down, time, distance, and other in-game factors.
Expected points added (EPA) measure the difference in EP from one play to the next. A positive EPA indicates that the previous possession was successful, and a negative EPA comes from an unsuccessful play (loss of yards, drop, interception, etc.).
Now let’s apply EPA in a few ways.
There are free tools available that calculate EPA per play. EPA per play is the average of a team’s EPA over one or multiple games. We can use the metric more accurately to compare offensive efficiency since it accounts for the scenario on each attempt. Using the results from the 2022 season, we can see a lot of familiar teams at the top.
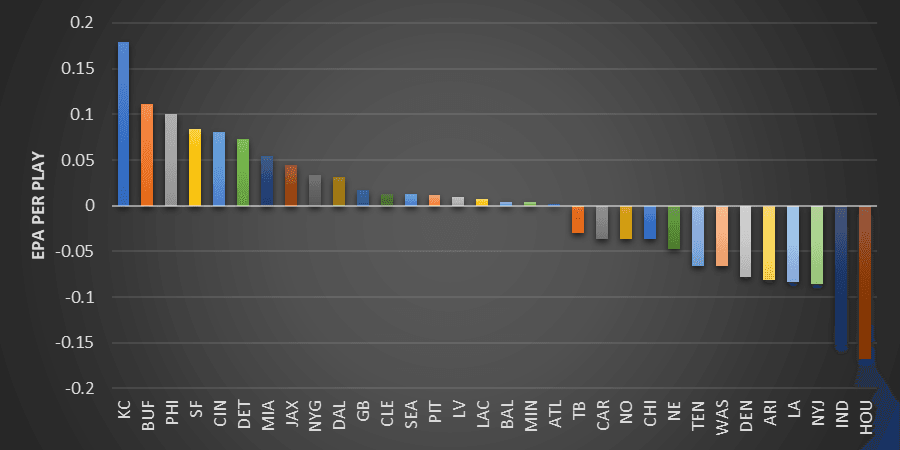
Yards per game above were somewhat similar to these EPA per play rankings, and factoring in average yards gained inside an opponent’s 35-yard line got even closer to these EPA per paly rankings.
Now you know why. Because EP values are correlated with field position, a team like Cincinnati's offense was efficient where it mattered more on the field to boost their ranking.
But we can take a more granular view to monitor each offense during the season rather than waiting until the season is over. Coincidentally, we were using EPA during the playoffs, just a little differently.
Cumulative EPA is the sum of every EPA value (positive or negative).
As a team runs more plays, the total EPA rises and falls. Rapid shifts in the aggregate can signify changes to an offense or personnel changes allowing us to draw conclusions about future outcomes.
For instance, let's look at the Bengals' cumulative EPA below heading into the 2022 AFC Championship game.
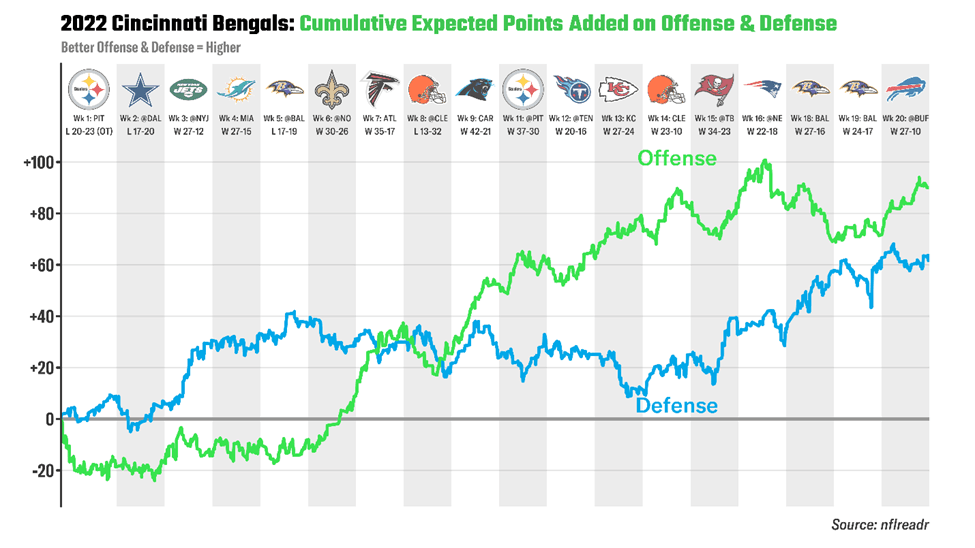
Cincinnati was 3-3 through the first six weeks last season, and there was immediate concern for the offense. Burrow wasn’t hitting the same downfield shots as the year prior, and the running game ranked just 26th in success rate over that span.
The Bengals' tendency to call running plays from under center was a tell. But as they revamped the offense, their cumulative EPA rose. even though they stumbled along the way with a primetime loss to Cleveland and reliance on turnovers against Tampa Bay.
Still, cumulative EPA allowed us to pinpoint when the coaching staff and personnel adjusted the offense on their road to the playoffs during the 2022 season.
Pros and Cons of EPA
Pros
Forget about fantasy football for a moment.
The only thing NFL teams care about is winning games, and they need to score points to win. While adjusting for game state, the EP metric focuses on the likelihood of an offense generating points. The benefit of EPA is that the metric accounts for all the factors that matter in a game.
A sack or fumble produces negative EPA. Big gains on the field result in big gains in EPA. There’s no additional context required because the scenario and result are both already included as parts of the calculation of EPA.
Cons
The main drawback to EPA is that the data and associated tools aren’t widely available. While analysts quote or use it for their content (myself included), there are limited access points to data repositories to understand the metric better or make advances.
With finite resources, public knowledge will lag, stymying our collective growth.
How is EPA Used in Fantasy Football?
During fantasy football draft season, the market guides ADP as hype or doubt shapes how we feel about each player or team. However, we can (and should) target players attached to efficient offenses.
That said, EPA doesn’t doesn't stay constant year over year, as it will change based on personnel and staff as each NFL team evolves. The last five years highlight a few catalysts.
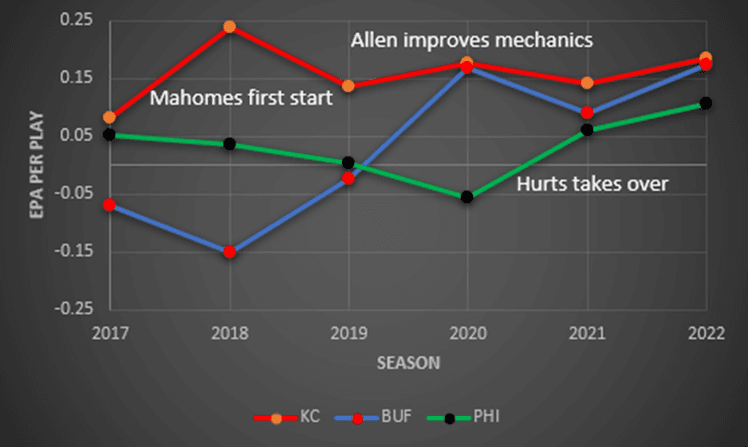
Patrick Mahomes has found sustained success with Andy Reid and Travis Kelce at his side. Continuity on the field and within the coaching and front office ranks have kept the Chiefs on top.
However, sometimes change can be good. Carson Wentz’s flameout gave rise to the Jalen Hurts era, and the legendary turnaround for Josh Allen is what gives other NFL teams hope for their respective QB prospects eventually panning out as well.
In general, EPA is heavily influenced by quality of QB play. Drafting RBs, WRs, and TEs attached to proficient signal-callers can help set our fantasy rosters up for success.
Cumulative EPA also helps us see how a team is progressing throughout the season. Every injury, scheme change, or trade can make a difference, and it’ll show up in the EPA totals. Increases or decreases to an NFL teams' cumulative EPA should affect our expectation for fantasy production for the players on those teams.
How is EPA Used in Sports Betting?
Admittedly, I’m a novice bettor. Sports betting recently opened in Ohio, so I’m catching up on betting terms and strategies.
But let’s keep it simple. Based on one season of data and final-season EPA averages, a few stats that I've found helpful when it comes to betting team totals and point spreads are as follows:
- There were 250 instances of a team meeting or exceeding its projected point total:
- The top-12 teams in EPA per play accounted for 97 of those games.
- The bottom-12 teams in EPA per play accounted for 96 of those.
- There were 244 instances of a game meeting or exceeding its projected point total:
- The top-12 teams in EPA per play accounted for 100 of those games.
- The bottom-12 teams in EPA per play accounted for 84 of those.
- There were 110 instances of a game exceeding its projected point total by ten or more points:
- The top-12 teams in EPA per play accounted for 47 of those games.
- The bottom-12 teams in EPA per play accounted for 39 of those.
- When two top-12 teams in EPA per play faced off, the over hit 54.3% of the time.
- When two bottom-12 teams in EPA per play faced off, the over hit just 28.1% of the time.
Overall, EPA can help us identify the teams with the best chance to score in any given game. However, betting lines are typically efficient, so EPA may only provide a small edge on how to place your bets.
Speaking of placing your bets, you can get $150 in bonus bets by placing a $5 pre-game moneyline bet thanks to DraftKings Sportsbook. All you have to do is sign up for a new account below and if your bet wins, you get $150 in bonus bets. Claim yours below!
Get $25 Guillotine League Credits When You Join FL+
Lorem ipsum dolor sit amet, consectetur adipiscing elit. Nunc tinciedunt, ex sit amet cursus gravida, dui mauris vulputate felis.
Published Updated