
Week 9 Fantasy Football Utilization Report: Jonah Coleman Leads Key Takeaways
Welcome to the Utilization Report, where Dwain McFarland recaps all the Week 8 NFL action to get you ready for Week 9 in fantasy football.
Welcome to the Utilization Report, where Dwain McFarland recaps all of last week's NFL action to get you ready for Week 9 in fantasy football.
The Top Fantasy Football Takeaways for Week 9
Let's follow the data to identify the top waiver wire options, trade targets, upgrades, and downgrades based on what we learned in Week 8.
If you love the sweet Utilization data below, you can access it all for yourself!
- Comparison tool
- Team-based views with game logs
- League-wide views for NFL leaders
- Customizable time periods and sample sizes
- Seasons: 2020 to 2026
Use the Utilization Report suite of tools to dominate your league, y'all!

Join Our Newsletter
Trusted by 400,000+ fantasy football players. Get access to Fantasy Life's free award winning newsletter and tools, all in one step.
By registering or logging in, you agree to our Terms of Use and Privacy Policy.
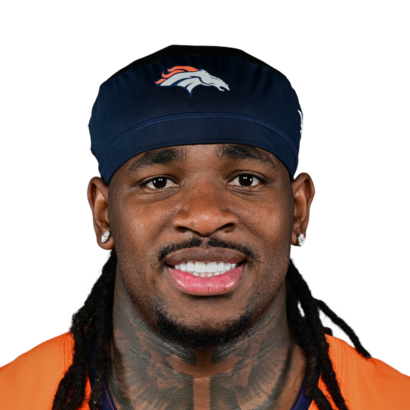
 1. Jonah Coleman Siezes The Broncos Backfield
With RJ Harvey placed on IR ahead of Week 8, the Broncos backfield condensed down to Coleman and J.K. Dobbins. The fourth-round rookie RB stepped into the driver's seat, monopolizing 68% of the snaps and scoring 20.4 points with an 84 Utilization Score.
Coleman handled 52% of the rushing attempts, still sharing with Dobbins. But he took the high-leverage work, handling 86% of short-yardage snaps (LDD) and logging a 56% route share. Coleman took 4 of 5 attempts inside the five-yard line.
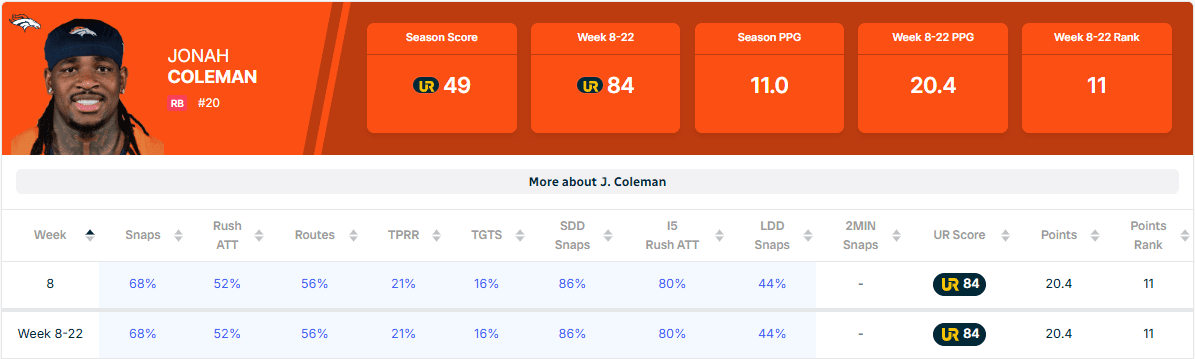
He finished the day with 11 attempts and four targets.
Coleman only has 30 attempts versus 94 for Dobbins, but the early results point to the rookie as the superior option in most categories:
- Yards per carry: 4.5 vs. 3.3
- Yards after contact: 2.37 vs. 2.43
- 10+ yard attempts: 16.7% vs. 5.3%
- Yards per route run (YPRR): 2.94 vs. 0.71
- Targets per route run (TPRR): 27% vs. 21%
Coleman's biggest obstacle is probably no longer Dobbins. It might be Jonathan Taylor, who the Broncos are reportedly pursuing via trade. If Taylor heads to the Mile High City, Coleman's fantasy value would plummet to handcuff status.
If the Broncos don't add another high-quality back, Coleman's outlook over the next three games without Harvey is great. He has the third-best RB schedule (+1.8 PPG): CAR (+4.1), BYE, LV (+3.3), PIT (-1.9 PPG).
Jonah Coleman short-term outlook assuming no RB trade
This scenario assumes Coleman maintains a slight edge over Dobbins as a ball carrier and is the No. 1 backfield passing-game option until Harvey returns. His historical Utilization Score comparisons averaged 15.8 PPG, with 55% securing RB1 runouts.
- RB1-6 producers: 15% (ceiling outcome)
- RB7-12 producers: 40% (high-end median outcome)
- RB13-18 producers: 33% (low-end median outcome)
- RB19-24 producers: 13% (floor outcome)
The Broncos were in comeback mode against the Chiefs in Week 8, which helped Coleman since he is the pass-down option. This outlook reflects that, recognizing his role could change in closer games. Of course, the Broncos could go all-in on Coleman, which would push his ceiling hit rates higher than above.
Coleman UPGRADES to mid- to high-end RB2 territory over the next three games with Harvey out if they don't trade for another RB.
Jonah Coleman rest-of-season outlook assuming no RB trade
Harvey is eligible to return as soon as Week 13. In this scenario, I am assuming Harvey is ready by then and reclaims a significant portion of the passing-down work. Coleman remains the No. 2 passing-down RB and the lead rushing RB, but still shares some with Dobbins.
We saw a small sample size of this scenario in Week 7 when Coleman played 50% of the snaps, handled 41% of attempts, and earned an 8% target share on a 25% route share. He scored 8.9 points with a 50 Utilization Score. I am giving Coleman a slight bump up from these numbers as the ascending option.
His comparisons averaged 12.6 PPG, with 40% posting RB2 finishes.
- RB1-12 finishes: 12% (ceiling outcome)
- RB13-24 finishes: 40% (high-end median outcome)
- RB25-36 producers: 43% (low-end median outcome)
- RB37-48 producers: 5% (floor outcome)
To be clear, this is how Coleman looks after his stint as an RB2 over the next three games. And Harvey may not be ready in Week 13.
The Broncos have the 2nd-best RB schedule the rest of the season (+1.5 PPG).
Upon Harvey's return, Coleman would be a borderline RB2, but offers high-end RB2 upside if the Broncos remain firmly committed to his current role.
Coleman range-of-outcomes recap:
- High-end RB2 until Harvey returns.
- Borderline RB2 upon Harvey's return.
- Handcuff RB5 if the Broncos trade for a high-quality RB like Taylor.
 2. Ashton Jeanty Plays A Pure Passing-Down Role In Week 8
If you are an avid reader of the Utilization Report, you've probably already pawned off Jeanty to another fantasy manager.
The former Round 1 pick hasn't been able to get anything going on the ground, dealing with injuries and poor offensive line play.
- Yards per carry: 3.1 (29th among 29 RBs with at least 75 attempts)
- Yards after contact: 2.67 (23rd)
- 10+ yard attempts: 4.6% (28th)
- Missed tackles forced: 9.3% (28th)
- Raiders RB yards before contact: 0.73 (28th out of 32 teams)
I called out caveats about his injuries and the blocking, but we also must acknowledge another potential reason: Jeanty just isn't the prospect we thought he was.
He remains a revelation via the passing game, ranking third in target share (17%). His 2.15 YPRR ranks second among all RBs with at least 75 routes. That is high-end WR2 territory!
But Jeanty's Utilization has been in a free fall outside of his passing-game work over the last month. And we hit rock bottom in Week 8. Klint Kubiak shifted 81% of the rushing attempts to Mike Washington, while Jeanty handled only 6%.
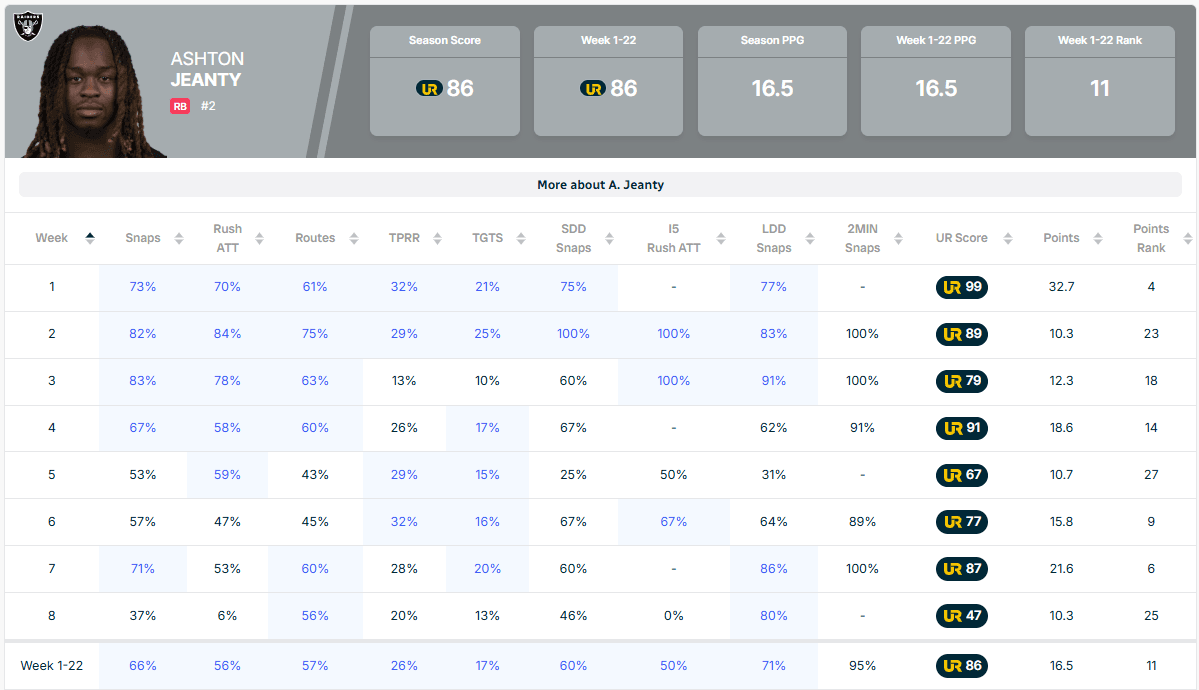
Jeanty called out some Jets defenders ahead of last week's game. That might have been a factor. Kubiak dismissed it after the game, but coaches don't always share disciplinary issues with the media.
The head coach went on to say, "He's gonna be a huge part of our run game going forward. Wanted to give Mike a few more opportunities today. I think both of those guys are gonna be a huge part of our rushing and passing success."
This is pretty generic coachspeak that I am sure people will twist in all sorts of ways this week (with no one really knowing the future plan). Personally, I don't see that as a ringing endorsement for either back. It sounds similar to the splits we saw heading up to Week 8.
But we must face the facts: Week 8 introduces a new floor for Jeanty. While it might not be likely, there is a world where Jeanty operates more strictly as a pass-down option the rest of the way.
That said, I think the only two moves on Jeanty right now are HOLD or BUY LOW. To start the season, I was a Jeanty champion who turned heel over the last month—and it was the right call. But now, I am willing to reposition again as the hero rather than the villain.
My reasons are simple: 1) His value is plummeting—the time to sell was two weeks ago; 2) he is one of the best receiving RBs in the game, which is a fantasy cheat code should the rushing volume come back his way.
This is what the Utilization Report is all about. We don't harken to priors. We stay fluid, with the marketplace as our guide. Buy-low and sell-high are relative terms based on the marketplace.
We must consider three scenarios to figure out what buy-low means.
Floor Scenario: Jeanty is only the receiving RB moving forward
This scenario is bad. But I don't think it is very likely, but it represents his floor. Jeanty's historical Utilization Score comparisons averaged 9.1 PPG. And 57% finished as RB4s.
- RB13-24 finishes: 4% (outlier ceiling outcome)
- RB25-36: 23% (ceiling outcome)
- RB37-48: 57% (median outcome)
- RB49-60: 16% (floor outcome)
Median Scenario: Jeanty is in a split backfield
This scenario assumes Jeanty plays a role similar to the four weeks before Week 8. Over that stretch, he had an 83 Utilization Score. His historical comps averaged 16.2 PPG with 62% posting RB2 seasons.
- RB1-12: 33% (ceiling outcome)
- RB13-24: 62% (median outcome)
- RB25-36: 5% (outlier floor outcome)
Ceiling Scenario: Jeanty regains an every-down role
In this runout, Jeanty regains his full-time status. This also doesn't seem likely, but if injuries are a factor, or if Washington disappoints/gets injured, it could be in the cards. For this scenario, we will use Jeanty's Utilization Score from the first three games (98), where he was a bell-cow RB.
His comparisons averaged 19.1 PPG, with 92% securing top-12 finishes.
- RB1-6: 72% (median outcome)
- RB7-12: 20% (floor outcome)
- RB13-24: 8% (outlier floor outcome)
Despite all my issues with Jeanty—he might never be a 20+ PPG RB like Jahmyr Gibbs—he offers the size and pass-catching chops to play a full-time role as the Raiders' Round 1 pick from 2025, which matters. That signal is fading fast, but it isn't completely gone.
Bottom Line: Jeanty has a wide range of outcomes.
I view the floor and ceiling cases above as outlier scenarios at this point—but lean more toward the ceiling than the floor.
I am willing to BUY LOW on Jeanty at a low-end RB2 price tag based on the median scenario.
Paying a mid-range RB2 price tag isn't unthinkable, but he has the second-hardest RB schedule the rest of the season (-0.9 PPG), so factor that into your approach.
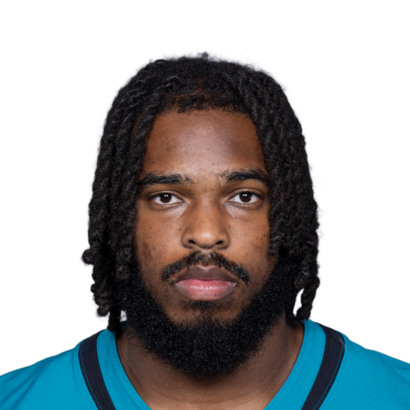
 3. Bhayshul Tuten Keeps Climbing The Rest-Of-Season Fantasy Rankings
Tuten has scored 24.7 and 29.9 points in his last two outings, and the Jaguars now rank as the No. 5 scoring offense (28 PPG). In Week 8, he handled 16 rushing attempts and was targeted twice. But on the surface, his Utilization shares were concerning: 54% snaps, 53% attempts, 22% routes.
That held his Utilization Score down (69) despite the fantasy blowup.
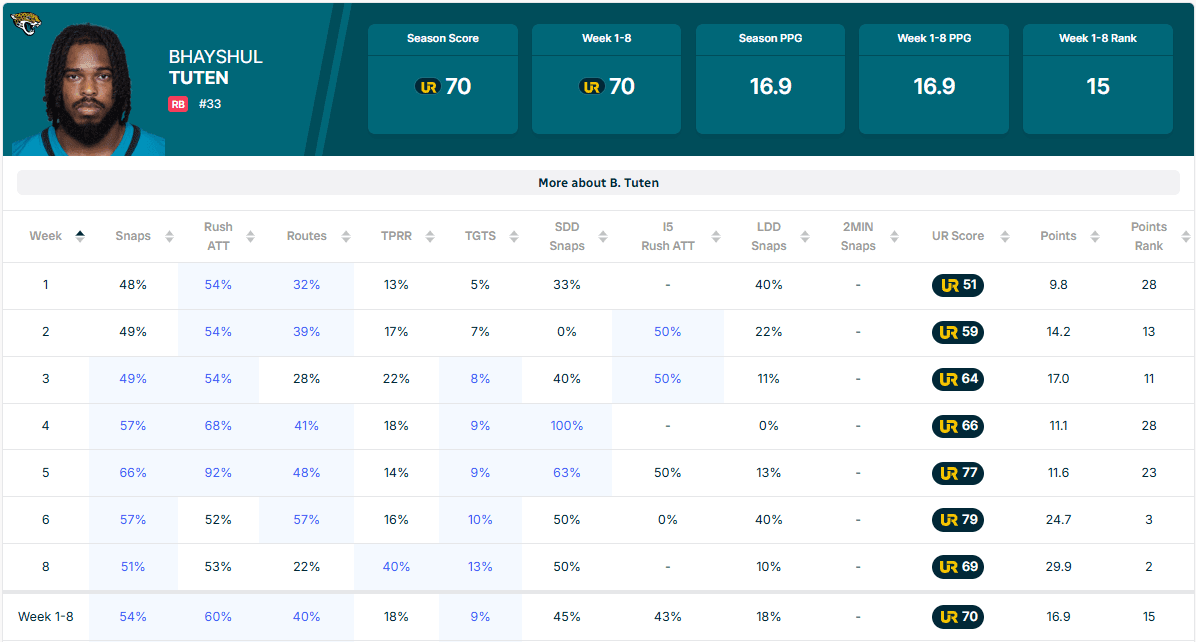
But when we dig deeper, those numbers are misleading. In a massive blowout game, where the Jaguars built a 14-point lead by halftime, Tuten played only 9 of 12 possessions. Before exiting, he led the backfield with 61% of the snaps and 64% of the totes.
In the first half, it was even higher: 66% and 72%.
The biggest concern: Tuten's route share was down across all time frames. In the first half, it was 7%, and over nine drives it was 16%. Those numbers came after a season-high of 57%. But once again, they designed looks to get their explosive playmaker into space, with two screen plays. One went for 30 yards, and the next went for a 25-yard TD.
Tuten also ripped off a 39-yard TD run, breaking through multiple defenders. He now ranks 4th among 33 RBs with at least 60 attempts in average yards after contact (3.81) and ranks 13th in attempts to travel 10+ yards (10.9%).
We have an electric playmaker playing in one of the best offenses in the NFL, and he might have a larger role than anyone realizes. That is a great combination.
Over the four weeks, Tuten is averaging 19.3 PPG with a 79 Utilization Score. After adjusting for the Week 8 game script, his score moves to 82. His historical comparisons averaged 16.0 PPG with 57% reaching top-12 status.
- RB1-6 finishes: 17% (ceiling outcome)
- RB7-12: 40% (high-end median outcome)
- RB13-18: 31% (low-end median outcome)
- RB19-24: 8% (floor outcome)
He has the 8th-best RB schedule for the rest of the season (+0.6 PPG) and the 3rd-best over the next four games (+2.9), including two smash matchups against the Titans (+6.4 PPG).
Tuten UPGRADES to borderline RB1 status and offers high-end RB1 upside.
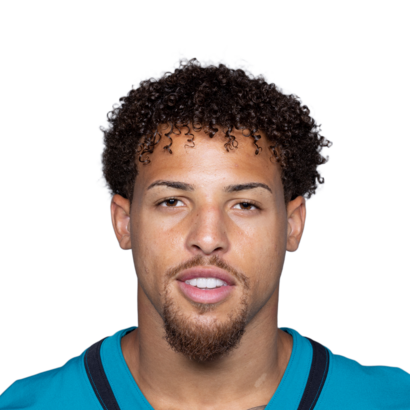
4. Parker Washington: Is the Jaguars offense too good?
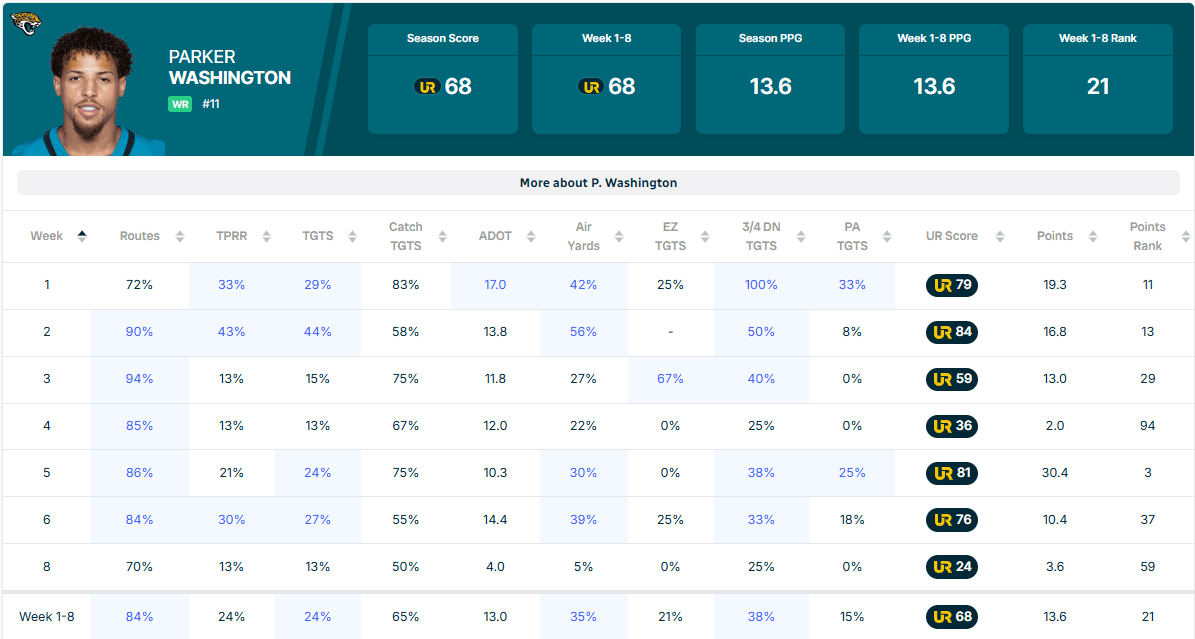
If you drafted Washington in Round 5 of your fantasy draft, you are feeling good about his 13.6 PPG (WR23). But we are greedy. We know Washington can do more. So what is going on with the boom-bust nature of his performances?
The answer is pretty simple: the Jaguars are too good. They have led by 4-plus points a league-high 44% of snaps.
- Snaps with a 4-8-point lead: 20% (5th)
- Snaps with a 9-16-point lead: 9% (13th)
- Snaps with a 17+ point lead: 15% (1st)
With that balanced, slow attack, they don't have enough passes to go around.
- Dropback rate over expected (DBOE): -1% (17th)
- Plays per minute: 1.9 (30th)
- Neutral playclock seconds remaining: 7.9 (24th)
All in, the Jaguars rank 31st in dropbacks per game (31.9). That has a trickle-down effect. Washington ranks 29th in targets per game (6.6) and 25th in air yards per game (85.6).
And in some contests, Washington doesn't have to play late. In Week 8, he had a 70% route share and got most of the fourth-quarter off.
Business is booming for Tuten, but we need more competitive game scripts to push the Jaguars offense for Washington.
The upcoming schedule is loaded with good WR matchups—Jacksonville has the second-best WR schedule (+1.8 PPG) for the rest of the season.
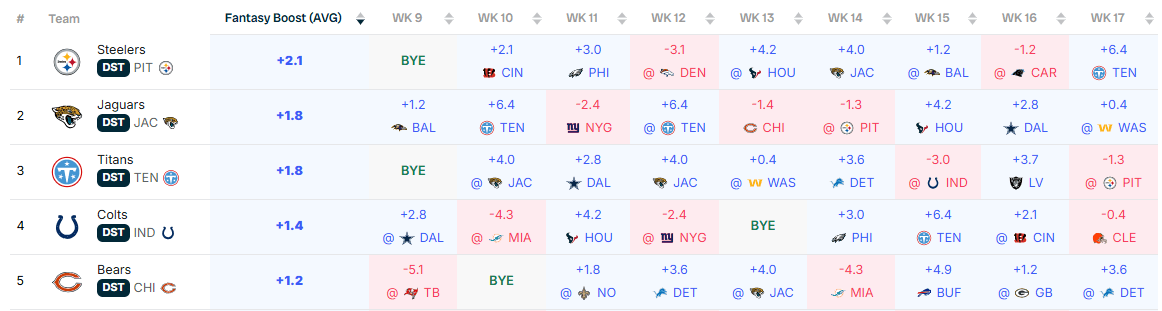
But the schedule doesn't have many offensive jaggernauts. The Bears (25.7 PPG) in Week 13 and the Cowboys (27.4 PPG) in Week 16 are the best bets. The Ravens don't have Lamar Jackson, and the Titans rank 28th (18 PPG).
Because Washington is a good player, he is slightly outperforming his Utilization Score (68). His historical comparisons averaged 13.1 PPG. But only 2% finished as top-12 options—which is the range we were hoping for a few weeks into the season. Most of his comparisons finished as WR2s or WR3s.
- WR1-12 seasons: 2% (outlier ceiling outcome)
- WR13-24: 32% (high-end median outcome)
- WR25-36: 43% (low-end median outcome)
- WR37-48: 11% (floor outcome)
Washington remains a must-start option in all formats, but fantasy managers will have to live with the up-and-down nature of his box scores. He DOWNGRADES to mid-range WR2 status but offers high-end WR1 upside when opposing offenses push the Jaguars.
 5. Post-Terry McLaurin: Commanders WR Utilization
In Week 8, Washington unveiled their new-look receiving rotation with McLaurin out for the season.
Antonio Williams played the largest role, leading the team with an 88% route share and 25% target share. He scored 10.4 points with a 61 Utilization Score. Williams operated underneath and intermediate with an 8.7-yard average route depth. He played from the slot on 36% of snaps and was in motion 13%.
Stefon Diggs and Treylon Burks each secured 79% route shares, with Diggs retaining his underneath role (7.8-yard route depth) from the slot (73%). Burks moved into the field-stretching role, playing from the boundary on 76% of snaps with a 9.9-yard average route depth. They scored 12.8 and 11.1 points with 61 and 54 Utilization Scores, respectively.
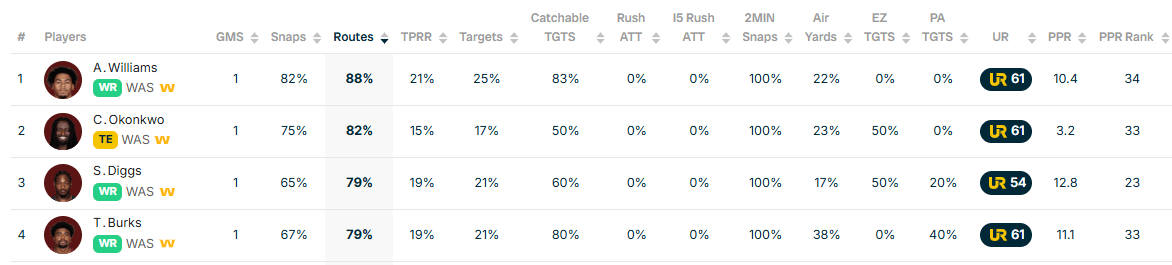
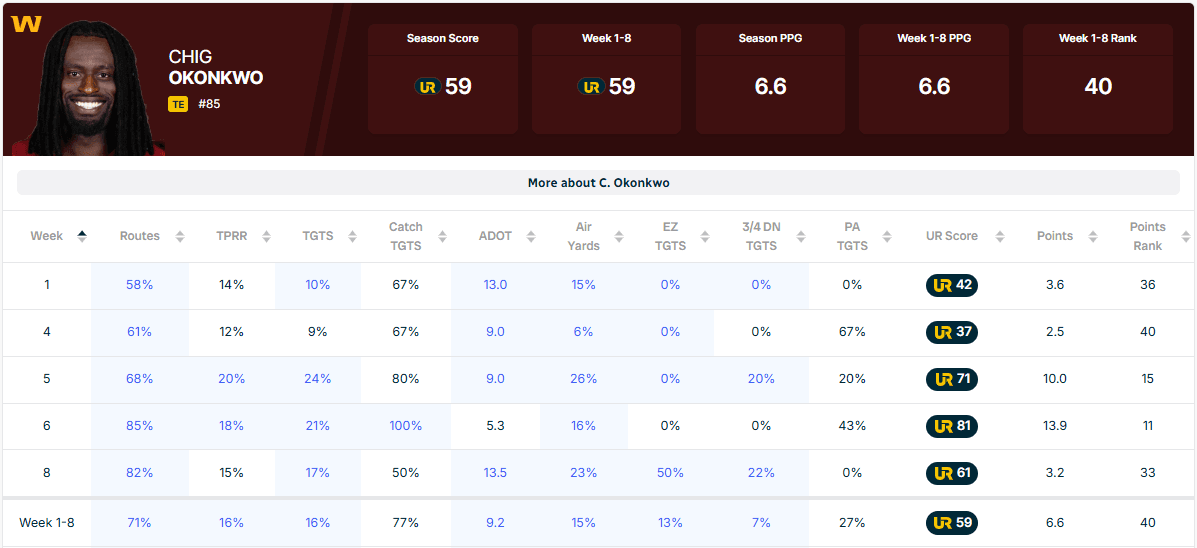
Chig Okonkwo controlled his second consecutive 80%+ route share at 82%. He was targeted 17% of the time and scored 3.2 points with a 61 Utilization Score.
This is a small sample, which makes pinning a range of outcomes on these players an interesting task. Basically, this gives us a starting point: we have an idea of who the Commanders want on the field. But we also have to consider the longer history associated with these players to project what it could mean.
Below is my first read on how this pecking order will shake out in terms of earning targets and scoring fantasy points:
Option No. 1: Stefon Diggs
Diggs leads the team with a 23% target share and has demonstrated fantasy viability, averaging 13.7 PPG in 2026. He is the most proven asset. He probably won't reach a 90% route share, even with McLaurin out.
But he gets favorable looks playing from the slot and was in motion a sizzling 38% of the time in Week 8. He is the player the Commanders are trying the hardest to create mismatches for.
His historical Utilization Score comparisons averaged 12.1 PPG, with 44% finishing as WR3s and 11% reaching WR2 territory.
Diggs is a mid-range WR3 with borderline WR2 upside.
Option No. 2A: Antonio Williams
Williams is the front-runner to lead the team in routes. If he can make strides as a target earner and improve upon his 18% TPRR (WR4 level), he offers the highest ceiling of the group.
The Round 3 draft pick out of Clemson received a 72 rating in the Rookie Super Model. He was mostly used underneath the coverage in college, but is already running deeper routes in the NFL. He has the raw attributes with a 4.41-second 40-yard dash at 6'0" and 187 pounds to grow as a downfield option.
His closest comparisons in the Super Model: Rashee Rice, Jaylin Noel, and Khalil Shakir. And 25% of his comps turned into WR3s.
Williams is a mid-range WR4 with WR2 upside. He is rostered in deep formats but available in 74% of Yahoo leagues.
Option No. 2B: Chig Okonkwo
Okonkwo and Williams are really tied for this spot. But Williams offers more big-play upside.
Still, Okonkwo has shown some ability when in a full-time role. In 14 career games with a route share of 75% or higher, he has averaged 8.2 PPG with an 18% target share. The door is wide open for Okonkwo to assert himself playing underneath the coverage with a 7.9-yard route depth. He is a solid YAC player.
Based on the last two games with McLaurin out/hurt, his historical Utilization Score comparisons averaged 8.7 PPG. And 56% of them were mid- to high-end TE2s.
If Williams or Burks don't ascend, Okonkwo should post career numbers.
Okonkwo is a mid-range TE2 with low-end TE1 upside.
Option No. 3: Treylon Burks
The 2022 Round 1 pick hasn't gained traction in the NFL, but he has a golden opportunity to revive his career with McLaurin out. Historically, most WRs that haven't broken out by this point don't. But Burks has battled injuries and team-environment issues for much of his career.
As a prospect, he graded much higher than Williams, with an 86 Super Model rating. The biggest concern coming out of college was Burks heavy diet of gimmick targets behind the line of scrimmage. But that isn't how the Commanders are using him. He is the vertical threat.
Burks UPGRADES to boom-bust WR5 status and should be rostered in deep formats. He is available in 98% of Yahoo leagues.
 6. Reassessment: Tetairoa McMillan & Jalen Coker
The Panthers stormed out to a hot start, but their passing game has fizzled over the last two games. Defenses are crowding the line of scrimmage and giving Bryce Young fits.
Young still ranks No. 4 in passing YPG (274), but looks more like his old self over the last two games with totals of 163 and 209. The Panthers signal caller is now the most-pressured QB in the NFL (45%) thanks to a slew of injuries:
- Guard: Damien Lewis (Knee - week-to-week)
- Guard: Brady Christianson (Hamstring - 21-day practice window opened)
- Tackle: Taylor Moton (Fibula - season-ending IR)
- Tackle: Ikem Okwonu (NFI - patellar tendon - could return next month)
The unit should improve as it gets healthy, but this is a significant short-term issue. There is also a chance that Young is regressing to his historical form.
For his career, Young has averaged 199 YPG in contests with at least 90% of the snaps. He has cleared 250+ yards in only 11 of 47 contests. But to his credit, four of those have come in 2026.
McMillan and Coker are still the top-two targets in a consolidated offense, but we must level-set our expectations until the offensive line gets back to health and/or Young shows an ability to handle loaded pressure boxes.
To do this, we don't need to do anything outlandish. We can simply acknowledge the recent downturn in production by including it in the season-long sample.
Tetairoa McMillan: Rest-of-season range of outcomes
McMillan has a Utilization Score of 72 in five games with Coker healthy (Weeks: 1, 2, 6, 7, 8). Two of those contests come in the last two games with the Panthers' passing game struggling. So, we have a near-equal blend of good Bryce Young and bad Bryce Young.
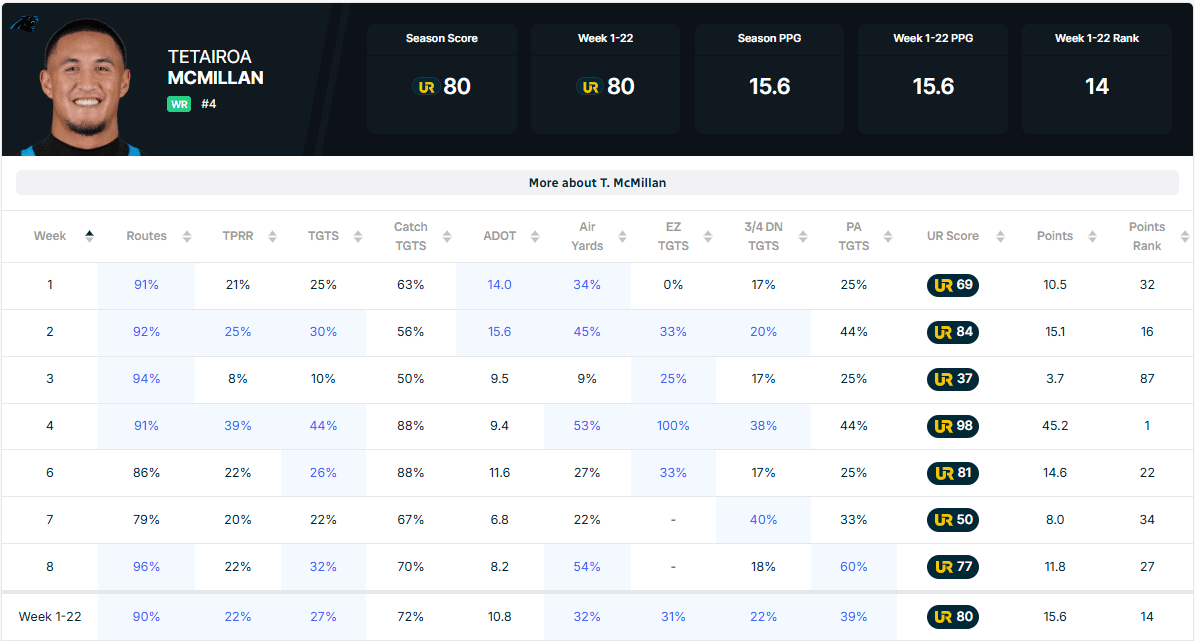
His historical comparisons averaged 14.1 PPG—well below his 15.8 for the season. Most (53%) were WR2s.
- WR1-12 seasons: 8% (outlier ceiling outcome)
- WR13-24: 53% (high-end median outcome)
- WR25-36: 29% (low-end median outcome)
- WR37-48: 9% (outlier floor outcome)
McMillan *sigh* DOWNGRADES to mid-range WR2 status.
Jalen Coker: Rest-of-season range of outcomes
Coker has a 66 Utilization Score in five healthy games. He has an average target share of 23% with 15.1 PPG.
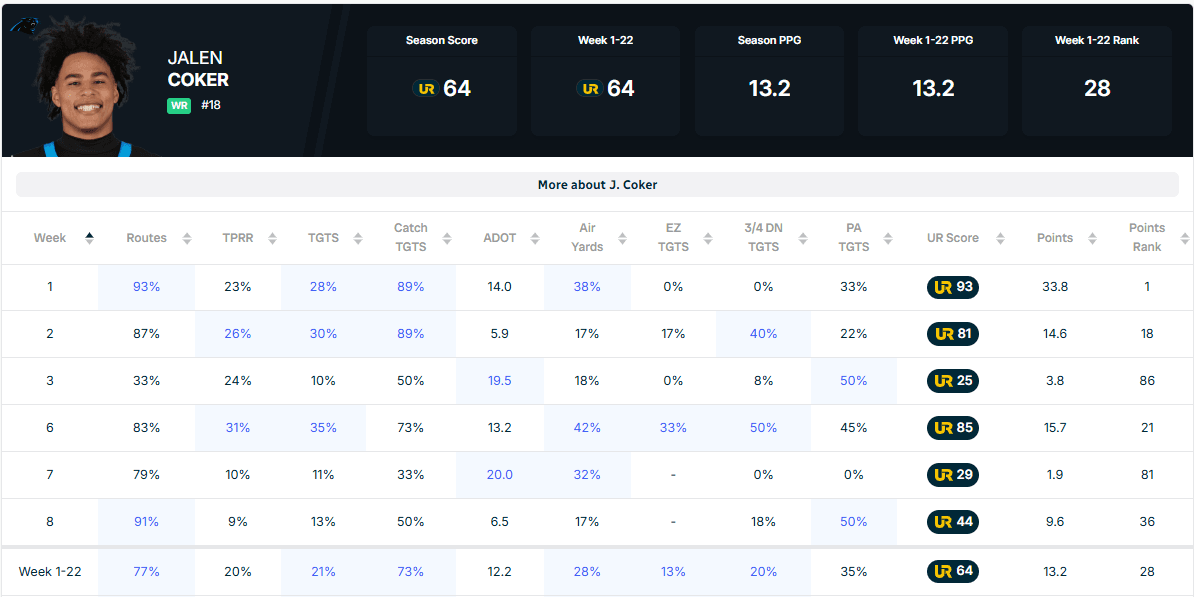
His historical Utilization Score comparisons averaged 12.8 PPG, with 47% finishing as WR3s.
- WR13-24: 23% (ceiling outcome)
- WR25-36: 47% (high-end median outcome)
- WR37-48: 28% (floor outcome)
Coker DOWNGRADES to mid-range WR3 status until we see the Panthers' passing offense regain control of the line of scrimmage.
7. Utilization Score Underperformers
The Utilization Score is made up of the fantasy data points that have historically correlated the most strongly with future fantasy success. It's similar to, but different from, expected fantasy points. How it differs:
- Accounts for snaps and routes in addition to attempts and targets.
- Accounts for catchable targets and catchable air yards.
- The underlying role accounts for ~75% of a player's Utilization Score.
- Uses fantasy points per game (PPG) as a proxy for talent (i.e., has the player done something with their opportunities). Fantasy PPG is worth ~25% of a player's Utilization Score.
 Ollie Gordon | RB | Dolphins
Gordon put up a disappointing 6.9 points in Week 8, but his underlying Utilization remained pristine: 83% snaps, 79% attempts, 69% routes. And that was with Jaylen Wright returning to the fold.
Gordon now has a 76 Utilization Score, averaging 14.3 PPG in five contests without De'Von Achane.
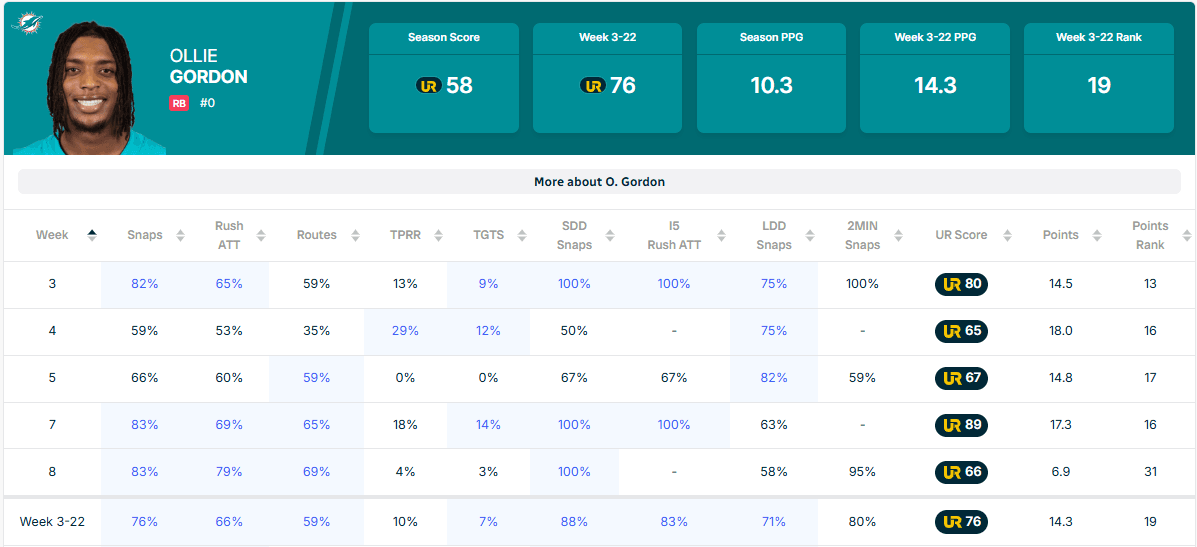
The Dolphins are showing signs of life on offense—a significant factor that held Gordon's outlook down early in the season. Over their last three games, they have averaged 23.7 PPG (16th) with 62.7 plays per game (13th). Their identity remains the run game, with a -12% DBOE.
And the second-year RB is running the ball well.
- Yards per carry: 4.5 (14th among 29 RBs with 75+ attempts)
- Yards after contact: 3.12 (12th)
- 10+ yard attempts: 13.2% (6th)
He has been a non-factor in the passing attack, which makes him a TD-dependent option, but that isn't unbearable in a run-first offense. The scoreboard doesn't carry the same weight in Miami's offense when it comes to opportunity.
Gordon's historical Utilization Score comparisons have averaged 14.7 PPG, with 64% finishing as RB2s.
- RB1-6: 6% (outlier ceiling outcome)
- RB7-12: 23% (ceiling outcome)
- RB13-18: 32% (high-end median outcome)
- RB19-24: 32% (low-end median outcome)
- RB25-30: 6% (outlier floor outcome)
The Dolphins have the 8th-best RB schedule over the next four games (+1.1 PPG): DET (-2.3), IND (+3.5), BUF (+2.7), NYJ (+0.3).
Gordon is a viable BUY-LOW trade target you might get at a low-end RB2 price tag. In that scenario, we profit on the trade almost 60% of the time.
 Carnell Tate | WR | Titans
Tate already made the buy-low list in previous weeks. But I wanted to mention him again since he missed last week with an injury and is on bye in Week 9, which could open the door for a favorable trade.
The No. 4 pick from the 2026 NFL Draft has a mouth-watering 27% target share. That ranks 14th in the NFL among WRs with at least 100 routes. In the last four games, he has reached 44% and 39%.
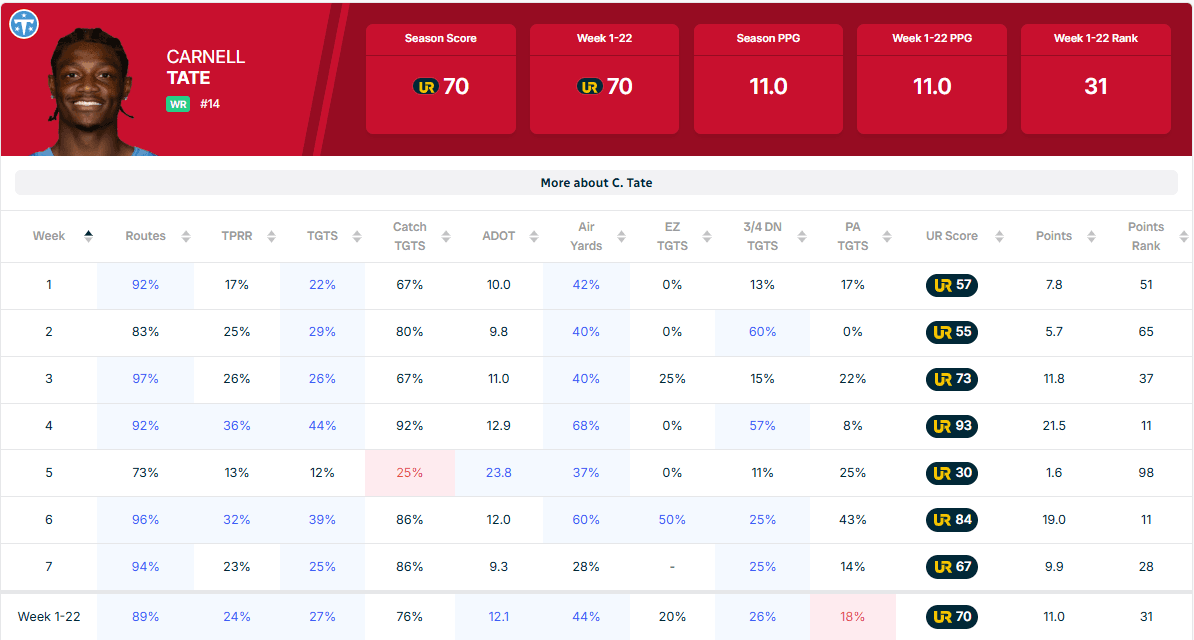
The Titans offense ranks 28th in scoring offense (18 PPG), which must improve to unlock Tate's ceiling. But they are showing some signs of life. Last week, Cam Ward logged his first 300-yard passing game, with Brian Daboll incorporating more designed run looks and RPOs.
- Weeks 1-4: 13% RPOs
- Weeks 5-8: 21% RPOs
Historically, Daboll has been at his best with QBs that are integrated into the run game to set up the offense. And Ward handled a season-high 13% of the designed runs in Week 8.
It is a small sample, but these are the sorts of schematic changes that can unlock fantasy upside.
Tate's historical Utilization Score (70) comparisons averaged 13.1 PPG with a balanced wide range of outcomes:
- WR13-24: 34% (ceiling outcome)
- WR25-36: 38% (median outcome)
- WR37-48: 26% (floor outcome)
Tate has the 3rd-best WR schedule over his next four games after the bye (+2.8 PPG): JAX (+4.0), DAL (+2.8), JAX (+4.0), WAS (+0.4).

Tate is HOLDING STEADY as a high-end WR3 with WR2 upside. I am willing to take the plunge at a mid-range WR3 price tag or lower.
Note: For more buy-low options, check out the Utilization Bytes below. And last week's buy-low on Nico Collins still applies coming off the bye week.
8. Utilization Score: Overperformers
 Derrick Henry | RB | Ravens
With Lamar Jackson (thumb - IR) potentially out for the season, plus Tyler Huntley expected to miss multiple games with turf toe, I want out from under Henry now.
Henry managed to scrape together 14 points last week, and his season-long average of 17.1 might still look appealing to an RB-needy leaguemate. Especially given his name.
The Ravens will explore trade options, but a new QB will take time to acclimate. Their game plan could be to load him up, but Henry's efficiency has declined without Jackson helping provide a gravitational pull on run defenses in 2026.
- Yards per attempt: 4.5 with Jackson vs. 3.5 without
- Yards after contact: 3.4 vs. 2.9
- 10+ yard attempts: 10.7% vs. 8.4%
His Utilization Score in games with Jackson playing less than 50% of snaps is 61. In those games, he has averaged 11.5 PPG. His historical comparisons averaged 11.5 on the nose, with only 4% securing top-12 finishes.
- RB1-12: 4% (outlier ceiling outcome)
- RB13-24: 27% (ceiling outcome)
- RB25-36: 57% (median outcome)
- RB37-48: 13% (floor outcome)
He is KING HENRY, so his odds of an RB2 finish are probably higher than what the model shows, but this is not the top-12 RB we drafted.
Henry DOWNGRADES to mid-range RB2 territory and could quickly fall to borderline RB2 status. If we can get a low-end RB1 or high-end RB2 return, we are still probably profiting in most runouts.
Note: For more sell-high options, check out the Utilization Bytes below. And don't miss last week's write-up on Cam Skattebo (day-to-day).
9. Waiver Wire Roundup
QB WAIVER WIRE OPTIONS FOR WEEK 9 IN FANTASY
- Malik Willis | Dolphins: Miami's offense is showing signs of life, and the play volume is rising (see Gordon write-up above). This is still a run-first offense (-9% DBOE), but Willis is a dual-threat archetype with a favorable four-week stretch ahead (+2.6 PPG): DET (+6.6), IND (+1.5), BUF (+1.7), NYJ (+0.8). Willis is averaging 20.8 PPG over the last three weeks. He UPGRADES to mid-range QB2 status and offers low-end QB1 upside. Willis is available in 80% of leagues.
- Anthony Richardson | Colts: Richardson has a long way to go to become a viable NFL passer, but his dual-threat ability could put him on the fantasy map. Daniel Jones will start in Week 9, but the leash is shorter than ever. The Colts have the 7th-best QB schedule over the next four weeks (+1.9 PPG): DAL (+3.4), MIA (+1.0), HOU (+0.6), NYG (+2.6). The Giants have been especially vulnerable against rushing QBs, giving up a 5.0 boost on the ground. Richardson is a QB2 stash play in deep formats.
- Not interested (unless Superflex): Gardner Minshew. Mike LaFleur was non-committal when asked about his Week 9 starter, but my gut says it will be Minshew. He was great against Dallas in Week 8, scoring 19.5 points in one half, but the Cardinals have the sixth-hardest QB schedule over the next four weeks (-1.4 PPG): SEA (-7.3), LAR (-2.4), KC (-1.4), WAS (+5.3). We could easily see Carson Beck before we get to that Commanders matchup. Minshew is available in most leagues and was the fifth-most-added QB in early waiver wire action. But he won't be startable this weekend and could be on a short leash. Minshew is a low-end QB2.
RB WAIVER WIRE OPTIONS FOR WEEK 9 IN FANTASY
- Mike Washington | Raiders: Washington has carved out a significant workload over his last four healthy games. His attempts: 35%, 47%, 40%, 81%. While I don't expect him to keep an 81% rush share, I also can't rule it out given how poorly Jeanty has performed. My intuition says this is probably a 50/50 split at best, but that would give Washington stand-alone value and high-end RB2 contingent upside if I am too low on the split or if Jeanty gets injured. Washington UPGRADES to mid-range RB3 status and offers RB2 upside. He is available in 73% of Yahoo leagues and should be rostered in most formats.
- Devin Singletary | Giants: Cam Skattebo (hamstring) is day-to-day, and Singletary was already in line for an expanded role with Tyrone Tracy on IR. Singletary could force a 50/50 time share or get the hot-hand treatment with Skattebo. If Skattebo is out, Singletary would be a mid-range RB2 with RB1 upside in Week 9. Singletary is available in 95% of Yahoo leagues and still remains on some deep-league wires, where he should be rostered.
- Emmett Johnson | Chiefs: Johnson's role didn't change in Week 8. He remained firmly seated behind Kenneth Walker with a 19% snap share. But his 25.3-point outburst even got my wife excited, so you can bet that he is back on the fantasy radar in your league if available. Johnson has been listed as the top-tier 1 handcuff for multiple weeks in this section, so hopefully he is already on your roster. If not, I am not going all-in on him in FAAB in smaller leagues, because he doesn't offer standalone value most weeks. Johnson is a top-three fantasy handcuff and is available in 81% of Yahoo leagues.
- Ray Davis | Bills: James Cook landed awkwardly on his neck in Week 8. He is reportedly fine, but this is a reminder that Davis would likely take over most of the early-down work in a great offense if Cook missed time. Davis is a Tier 2 handcuff who is available in 96% of Yahoo leagues.
- Tank Bigsby | Eagles: Given Saquon Barkley's health concerns, Bigsby enters the Tier 2 handcuff range upon return. That could happen as early as Week 9. He doesn't reach Tier 1 status due to offensive concerns, and Will Shipley could return in Week 11. The two split the backfield without Barkley earlier this season. Bigsby is available in 89% of Yahoo leagues.
- Tier 1 Handcuffs: Emmett Johnson (81%), Kaelon Black (69%), Chris Rodriguez Jr. (74%), Seth McGowan (71%), Brian Robinson Jr. (hamstring, 75%), Mike Washington Jr. (73%), Samaje Perine (89%)
- Tier 2 Handcuffs: Tyler Goodson (99%), Ray Davis (96%), Justice Hill (95%), Marshawn Lloyd (61%), Tank Bigsby (89%)
- Longview Players Your Leaguemates Could Cut: Samaje Perine (89%).
- IR Stash: Jonathon Brooks (62%). Expected to return between Week 10 and 11. Panthers' offense is much improved. Probably only a Tier 1 handcuff at this point, given how well Hubbard is playing.
WR WAIVER WIRE OPTIONS FOR WEEK 9 IN FANTASY
- Jordyn Tyson | Saints: My weekly friendly PSA: Tyson is an alpha target hog when healthy and could return in Week 9. If he is on your waiver wire, you have one assignment this week: secure Tyson. He is a mid-range WR3 with WR2 upside in a high-volume offense. He should not be available in 48% of Yahoo leagues.
- Commanders WRs: See No. 5 above.
- Tank Dell | Texans: With Jaylin Noel out for the season, Dell could push for the starting slot role. We don't know if Dell can ever return to his rookie-season heights, but he offers theoretical play-making upside if the Texans decide to tighten their WR rotation coming out of the bye. Dell is a WR6 stash option that is available in 85% of Yahoo leagues.
- Ryan Flournoy | Cowboys: There are rumors that the Cowboys could move George Pickens. Flournoy would step into the No. 2 role with Dak Prescott and move into WR3 territory if that happens. If not, you have a WR5 bye-week filler that already averages 9.6 PPG and has contingent upside if CeeDee Lamb or Pickens misses any time. Flournoy is available in 66% of Yahoo leagues.
- Demarcus Robinson | 49ers: Robinson should return in Week 9 and could push for playing time as the WR3 in a unit with repeat-flyers in the injury department in Mike Evans and Deebo Samuel. Robinson isn't startable right away, with Samuel and Evans likely to play. But offers contingent WR3 upside for deep leagues.
- Can cut: Ja'Kobi Lane (Jackson out).
- SICKO STASHES: Treylon Burks (99%)
- Longview Players Your Leaguemates Could Cut: Omar Cooper Jr. was the odd-man out in Week 8, but ran the same number of routes as Adonai Mitchell. Cooper was the most-dropped WR in early waiver-wire action. He is available in 27% of leagues, and that number will increase after more waivers run. Cooper is a high-end WR4 with WR2 upside.
- IR Stashes: De'Zhaun Stribling (75%, targeting December return), Alec Pierce (53%, TBD)
TE WAIVER WIRE OPTIONS FOR WEEK 9 IN FANTASY
- Longview Players Your Leaguemates Could Cut: Kenyon Sadiq (87%). Mason Taylor injured his quad at the end of Week 8. Sadiq could play an expanded role in Week 9 against Kansas City, the third-best TE matchup (+6.6 PPG).
- IR Stash: Terrance Ferguson (84%, could have his 21-day practice window open this week)
Team Trends To Monitor For Week 9 Fantasy Football
With at least five weeks, it's a good time to examine team-level trends that affect fantasy production. You can find the data across all 32 NFL teams in the Team Styles tab of the Utilization Report tools.
Redzone Drive Rate vs. Touchdown Drive Rate: Percentage of drives that reach the red zone versus how often the team is scoring a touchdown per drive. Large deltas indicate room for positive or negative regression. The NFL average delta is ~5-6%, and the average team reaches the red zone on 29% of drives.
Offenses that reach the red zone a lot and have room for more TDs:
- Bears: 13% (40% v 27%)
- Raiders: 12% (36% v 24%)
- Texans: 10% (33% v 23%)
Dropback Over Expected (DBOE): How often teams pass the ball compared to their peers when considering the score differential over the last six weeks:
- Packers: 9% (+1)
- Bengals: 7% (+2)
- Panthers: 5%
- Steelers: 4%
- Eagles: 4%
—
- Chargers: -4%
- Buccaneers: -6%
- Falcons: -9% (-2)
- Dolphins: -9% (+4)
Neutral Playclock: Teams that are leaving more or less time on the play clock when the score is within three points (neutral situations). The NFL average is 8.3 seconds.
- Cowboys: 11.92
- Browns: 11.12
- Chargers: 10.99
- Chiefs: 10.40
- Patriots: 10.22
—
- Steelers: 7.16
- Dolphins: 7.15
- Giants: 6.83
- Commanders: 6.06
Play action pass rate: Teams that are utilizing play action the most per dropback over the last five weeks, which adds value to WRs and TEs on a per-route basis in fantasy:
- Bills: 38%
- Lions: 35%
- Bears: 35%
- Chiefs: 33%
- Vikings: 33%
- Panthers: 33%
—
- Steelers: 19%
- Cardinals: 19%
- Bengals: 17%
- Saints: 17%
- Eagles: 16%
Personnel: When teams deploy more heavy personnel, with extra TEs and RBs on the field, the pass-catchers who remain face less target competition. For example: WRs saw a 29% boost in PPR points per route with two WRs on the field vs. three WRs over the last three seasons. Game scripts can impact this data over small samples.
21 Personnel (2 RB, 1 TE, 2 WR) – large boost
- 2026 NFL Average: 6%
- 49ers: 35%
- Chargers: 27%
- Personnel: McConkey
- Dolphins: 26%
- Vikings: 16%
- Giants: 14%
- Raiders: 13%
- Seahawks: 13% (Pre MNF)
22 Personnel (2 RB, 2 TE, 1 WR) – large boost
- 2026 NFL Average: 3%
- Giants: 19% (21 + 22 = 33%)
- Raiders: 15% (21 + 22 = 28%)
- 49ers: 10% (21 + 22 = 45%)
- Seahawks: 9% (21 + 22 = 24%) - Pre MNF
- Vikings: 7% (21 + 22 = 23%)
- Chargers: 7% (21 + 22 = 34%)
- Personnel: McConkey
11 Personnel (1 RB, 1 TE, 3 WR) – negative boost
- 2026 NFL Average: 55%
- Titans: 78%
- Eagles: 76%
- Browns: 73%
- Saints: 69%
- Cowboys: 66%
12 Personnel (1 RB, 2 TE, 2 WR) – small boost
- 2026 NFL Average: 23%
- Raiders: 47% → 58% last 3 games
- Personnel: Jalen Nailor, Tre Tucker; Brock Bowers, Michael Mayer
- Bengals: 42%
- Bears: 33% (Pre MNF)
- Chiefs: 31%
- Personnel: Xavier Worthy; Travis Kelce, Noah Gray
- Colts: 30%
- Lions: 30% → 39% last three games
- Personnel: St. Brown, Williams; LaPorta, Wright
13 Personnel (1 RB, 3 TE, 1 WR) – large boost
- 2026 NFL Average: 9%
- Rams: 35% (12 + 13 = 44%) → 49% 13P in 2 games without Adams
- Bills: 27% (12 + 13 = 49%)
- Cardinals: 26% (12 + 13 = 33%) → 31% 13P in 3 games after Harrison trade
- Personnel: Michael Wilson; Trey McBride
- Bears: 18% (12 + 13 = 51%) - Pre MNF
- Ravens: 15% (12 + 13 = 42%)
- Lions: 19% last 3 games (12 + 13 = 58% last 3 games)
- Personnel: Sam LaPorta (92% routes); 3-way WR rotation
Offensive Lines: Pressure rates are huge for QBs. Most signal callers who are constantly harassed will struggle to find consistent fantasy value. QBs partially own pressures, so it isn't all an offensive line issue. The NFL average pressure rate is 36% over the last three seasons.
Yards before contact matters for RBs. Backs who get better blocking have a better chance to thrive in fantasy. RBs also impact this number with their vision, acceleration, and elusiveness. The NFL average yards-before-contact on RB attempts is 1.28 over the last three years. It is important to remove QBs since scrambles often come with defenders' backs turned and can inflate these numbers.
Pressure Rate Allowed:
- 3-Year NFL Average: 36%
- 2026 NFL Average: 36%
- Change from last week in parenthesis
- Falcons: 28%
- Rams: 29% (-2)
- 49ers: 30%
- Bengals: 31%
- Lions: 32% (+1)
- Titans: 32%
- Cardinals: 32% (+3)
- Jaguars: 32% (+1)
—-
- Colts: 40% (+1)
- Ravens: 41% (+4)
- Seahawks: 41% (Pre MNF)
- Eagles: 42% (+1)
- Browns: 42% (+1)
- Patriots: 43% (+1)
- Chargers: 44% (-2)
- Dolphins: 44% (-1)
- Panthers: 45% (+1)
Average Yards Before Contact Rushing:
- 3-Year NFL Average: 1.28
- 2026 NFL Average: 1.15
- Bills: 2.37 (-0.24)
- Rams: 1.87 (-0.11)
- 49ers: 1.68
- Chiefs: 1.48 (-0.09)
- Vikings: 1.45
- Lions: 1.43 (-0.08)
- Bears: 1.41 (Pre MNF)
- Steelers: 1.40 (-0.24)
—
- Falcons: 0.84 (-0.04)
- Saints: 0.83
- Raiders: 0.73 (+0.03)
- Eagles: 0.72 (-0.11)
- Jaguars: 0.71 (+0.04)
- Packers: 0.70 (-0.12)
- Seahawks: 0.66 (Pre MNF)
- Defensive Tendencies
Pressure Rate: Defenses with high pressure rates can dramatically impact QB performance. Under pressure, QB statistics become much more unstable and decline at the macro level.
- 3-Year NFL Average: 36%
- 2026 NFL Average: 35%
- Vikings: 45% (-3)
- Seahawks: 44% (Pre MNF)
- Falcons: 41%
- Broncos: 40% (-2)
- Patriots: 39%
- Bears: 39% (Pre MNF)
—
- Titans: 30%
- Colts: 30%
- Cardinals: 30%
- Buccaneers: 29% (-1%)
- Giants: 28%
- Saints: 26%
Pass Blitz Rate: Defenses that blitz often can impact how often TEs and RBs run routes. Against heavy blitz teams, they can remain in to block more often. Teams that get pressure without blitzing can be tough to pass against.
- 3-Year NFL Average: 26%
- 2026 NFL Average: 30%
- Vikings: 71% (+2)
- Commanders: 41% (-2)
- Jets: 41%
- Giants: 40%
- Buccaneers: 40%
- Panthers: 39%
- Bears: 39%
- Patriots: 38%
—
- Raiders: 22% (average pressure rate of 36%)
- Lions: 22% (average pressure rate of 37%)
- Seahawks: 22% (elite pressure rate of 44%)
- Cowboys: 21% (average pressure rate of 30%)
- Colts: 21% (low pressure rate of 30%)
- Dolphins: 20% (average pressure rate of 35%)
- Bengals: 20% (average pressure rate of 36%)
Man Coverage: Targets skew toward the top WR options against man coverage, while TE and RB opportunities decline at the macro level. Of course, there are exceptions for elite TEs. Also, many teams that utilize man concepts have a shut-down corner, which can be problematic for WRs—especially if the CB shadows.
Scrambling QBs also benefit from man coverage. When defenders turn their backs, QBs can tuck the ball and run. And it can take defenders longer to realize it is happening (i.e., Jayden Daniels vs. the Giants in Week 5).
- NFL Average in 2026: 23% (Trending down from previous seasons)
- 2025: 24%
- 2024: 27%
- Browns: 41% (Denzel Ward. Will shadow.)
- WR units: +0.6 PPG boost (13th-best matchup)
- Giants: 34% (Deonte Banks. Will shadow.)
- WR units: -2.4 PPG (8th-hardest matchup)
- Jets: 31%
- WR units: -2.2 PPG (9th-hardest matchup)
- Patriots: 31% (Christian Gonzalez. Will shadow.)
- WR units: +1.9 PPG (10th-best matchup)
- Lions: 30% (D.J. Reed. Occasionally shadows.)
- WR units: +3.6 PPG (6th-best matchup; but -3.6 over last three games)
- Broncos: 28% (Patrick Surtain II. Will shadow.)
- WR units: -3.1 PPG (5th-hardest matchup)
- Bears: 28% (Pre MNF)
- WR units: -1.4 PPG (11th-hardest matchup)
- Bengals: 28% (DJ Turner II. Will shadow)
- WR units: +2.1 PPG (9th-best matchup)
Zone Coverage: Targets spread out against heavy zone teams. RBs and TEs get more involved, while WR targets tend to take a hit. There are exceptions. Underneath, WRs can benefit from zone.
- NFL Average in 2026: 71%
- Seahawks: 81% (Pre MNF)
- QB: -6.7 PPG (2nd-hardest)
- RB: -2.6 PPG (6th-hardest)
- WR: -5.2 PPG (hardest)
- TE: -4.1 PPG (3rd-hardest)
- Panthers: 81% (fired defensive coordinator after Week 8)
- QB: +2.7 PPG (7th-best matchup)
- RB: +4.1 PPG (3rd-best matchup)
- WR: -1.2 PPG (below average matchup)
- TE: +2.0 PPG (6th-best matchup)
- Packers: 79%
- QB: -3.4 PPG (5th-hardest)
- RB: +1.1 PPG (10th-best)
- WR: +1.2 PPG (above average matchup)
- TE: -3.1 PPG (5th-hardest; but have linebacker injuries)
- Saints: 78%
- QB: +0.6 PPG (average matchup)
- RB: +6.9 PPG (best matchup)
- WR: +1.8 PPG (above average matchup)
- TE: -0.2 PPG (average matchup)
- Vikings: 78%
- QB: -7.9 PPG (hardest matchup)
- RB: -4.1 PPG (hardest matchup)
- WR: -5.3 PPG (2nd-hardest matchup)
- TE: -3.7 PPG (4th-hardest matchup)
- Cardinals: 77%
- QB: +6.2 PPG (2nd-best matchup)
- RB: -2.7 PPG (7th-hardest matchup)
- WR: +0.1 PPG (average matchup)
- TE: +1.7 PPG (7th-best matchup)
Additional Defensive Trends:
- Buccaneers: Now right behind the Vikings and Seahawks as a bad matchup for most positions. The weather helped some in Week 8, so we will continue to monitor. They are also a highly valuable defense for fantasy—they might be matchup-proof. We will find out soon with the upcoming schedule: CHI, BYE, DET.
- QB: -5.2 PPG (3rd-hardest matchup)
- RB: -3.8 PPG (3rd-hardest matchup)
- WR: -5.1 PPG (3rd-hardest matchup)
- TE: 0.0 PPG (average matchup)
- Packers: Rapidly improving defense that should get Micah Parsons back sometime in late November. They also offer DST fantasy appeal. Their schedule is also challenging but better than Tampa's (NE, MIN, BYE, LAR). The data below is for the last four games:
- QB: -3.5 PPG (5th-hardest matchup)
- RB: -5.1 PPG (4th-hardest matchup)
- WR: -0.8 PPG (below average matchup)
- TE: -3.6 PPG (5th-hardest matchup)
MUG Looks: We are seeing more defenses aligning in all of the gaps with six-plus defenders in the box. This isn't necessarily new—it was popular about ~10 years ago—but offenses are struggling with it in 2026. It can confuse blocking assignments, and the QB and o-line must identify which players are coming or dropping into coverage. It adds another layer of movement on top of the safeties rotating post-snap, which can create hesitation. That can lead to more pressures, sacks, and turnovers.
The Vikings have been dominant with this look in 2026, so more teams are naturally trying it. The Buccaneers derailed the Cowboys' and Panthers' offenses with these looks. I'm collecting this data, along with which QBs handle it best/worst.
Players Mentioned in this Article
Presented by

Published Updated