
Fantasy Football Takeaways From Week 7: Omar Cooper & KC Concepcion Lead Utilization Report
Welcome to the Utilization Report, where Dwain McFarland highlights his top fantasy football takeaways heading into Week 8.
Welcome to the Utilization Report, where Dwain McFarland highlights his top fantasy football takeaways heading into Week 8.
The Top Fantasy Football Takeaways From Week 7
Let's follow the data to identify the top waiver wire options, trade targets, upgrades, and downgrades based on what we learned in Week 7.
If you love the sweet Utilization data below, you can access it all for yourself!
- Comparison tool
- Team-based views with game logs
- League-wide views for NFL leaders
- Customizable time periods and sample sizes
- Seasons: 2020 to 2026
Use the Utilization Report suite of tools to dominate your league, y'all!
 1. KC Concepcion is the Browns' No. 1 receiving option
Concepcion compiled 23.2 fantasy points against in Week 7. He might have had a 30-point outing if he hadn't dropped a deep throw. The Round 1 NFL pick was gaining momentum over the previous three healthy games, with 25%, 24%, and 26% target shares in a full-time role. That crescendoed at 29% against the Titans.
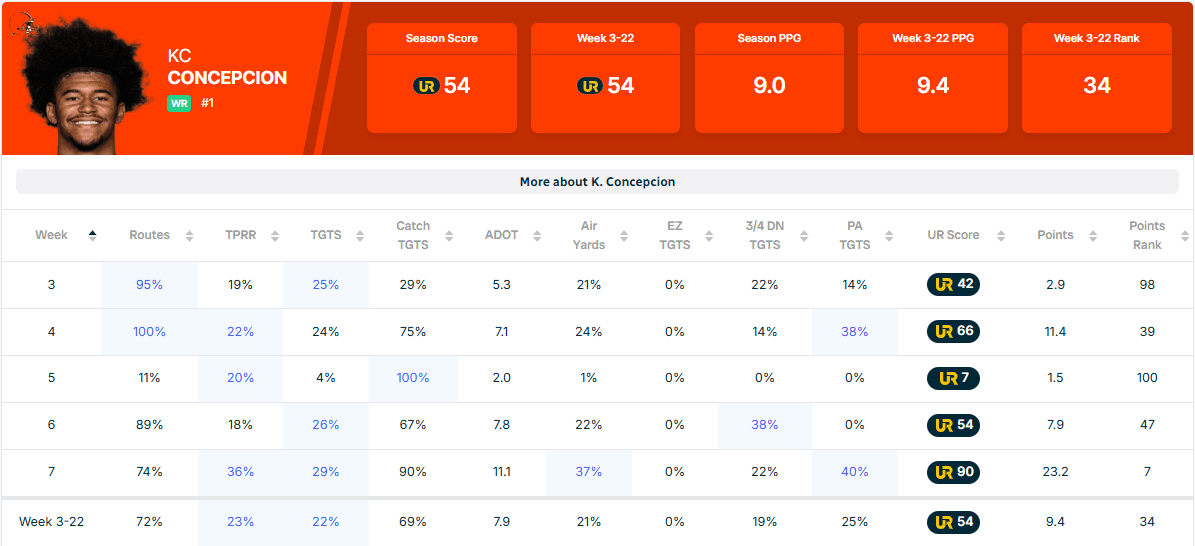
In Todd Monken's offense, he plays a role similar to Zay Flowers. Among 63 WRs with at least 150 routes, Concepcion ranks among the league leaders in cheat-code schematic advantages:
- Motion at the snap: 24% (4th)
- Percentage of targets on play action: 24% (17th)
- Slot alignment: 58% (5th)
This scheme is built to get the ball to its best playmaker and let him create after the catch. He ranks 7th in yards after the catch (YAC) at 5.7 per reception. And his yards per route run (YPRR) is now up to 1.69.
But Concepcion has also faced obstacles. First, his 6.5-yard aDOT ranks 57th. It can be hard to compile high-end outcomes in that range. However, Concepcion's average route depth (8.5) actually aligns more closely with names like Drake London, Malik Nabers, Ja'Marr Chase, and Matthew Golden. It is in the sweet spot for fantasy production.
Second, Concepcion plays in a below-average passing offense. The Browns rank 23rd in passing YPG (212). He also competes with two other viable receiving options: Harold Fannin and Denzel Boston. Concepcion and Boston complement each other, with Boston working as the vertical threat—his 10.7 average route depth ranks 8th. But Fannin (7.0 route depth) is working the same area of the field.
Still, it is impressive that, in his first year, Concepcion leads the team in targets per route run (23%), and that probably won't change given the scheme. He is averaging 10.7 PPG with a 61 Utilization Score in five healthy games as the starter. Historical comparisons averaged 11.7 PPG, with almost all finishing as WR3s or WR4s.
- WR13-24 seasons: 6% (outlier ceiling outcome → sell high)
- WR25-36: 40% (ceiling outcome → hold)
- WR37-48: 40% (floor outcome → buy)
- WR49+: 12% (outlier floor outcome → buy low)
Concepcion's optimistic ceiling is high-end WR3 territory, with 14% of his comparisons reaching that range. To reach WR2 territory, this passing attack needs more consistency.
Concepcion UPGRADES to low-end WR3 status.
 2. Omar Cooper: Flashes WR1 upside again
Cooper has delivered 22.3 and 22.5 fantasy points in his first two starts. Over the last two weeks, Cooper owns a 22% target share with a 78 Utilization Score.
Adonai Mitchell returned to the lineup in Week 7, which dramatically reduced Cooper's route share from 85% to 70%. But the fact that Cooper played more than Mitchell (55%) might be the more important data point—the door is open for the rookie to lock down the WR2 role in New York.
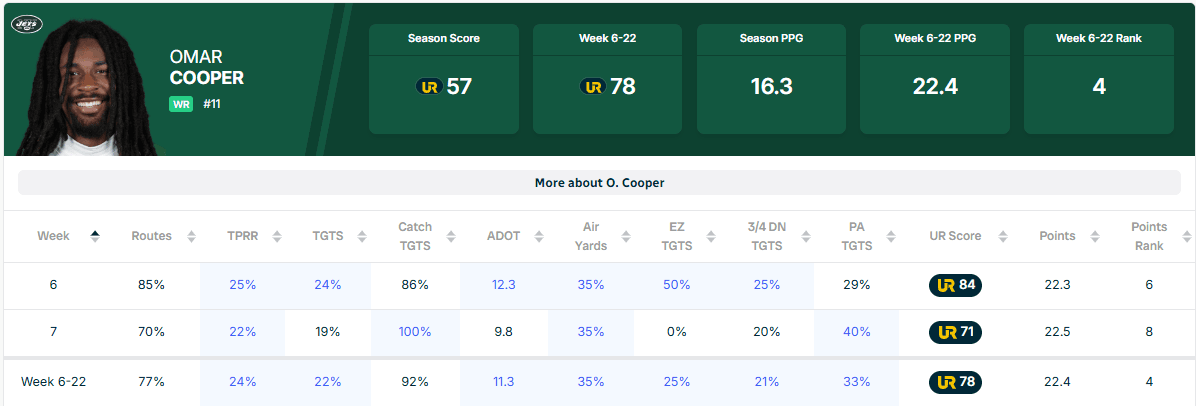
Cooper has a blistering 4.77 YPRR, and he is getting favorable scheme treatment.
- Motion at the snap: 17% (above average)
- Percentage of targets on play action: 31% (elite)
- Slot alignment: 55% (great)
The Round 1 NFL pick offers a unique blend of rugged YAC ability but also has the speed and size (6'0", 199) to compete downfield. The team is designing freebies in the scheme game (23%) while also targeting him on seam routes from the slot.
His screen routes are pulling his average route depth down (7.0), but make no mistake, Cooper is attacking multiple field layers and doing so on in-breaking routes:
- In routes: 21%
- Crossing routes: 12%
- Slants: 4%
The Jets rank 20th in passing YPG (232), which is right at the NFL average this year (235). If Cooper can secure an 85%+ route share over Mitchell, there is room for two viable fantasy options in this attack. But he will have to contend with Garrett Wilson and two young TEs in Mason Taylor and Kenyon Sadiq.
A couple of scenarios help frame Cooper's range of outcomes.
Scenario 1: Cooper remains in a 70-75% route share role.
In this scenario, Cooper's historical comparisons averaged 12.6. The majority finished as borderline WR3s.
- WR13-24 seasons: 20% (ceiling outcome → sell high)
- WR25-36: 43% (ceiling outcome → hold)
- WR37-48: 34% (floor outcome → buy low)
- WR49+: 2% (outlier floor outcome → buy low)
We don't know how the Jets coaching staff will handle this situation. Cooper is a Round 1 investment, but they also have other young players in their plans. But this is the most likely outcome in my opinion.
Cooper would be a low-end WR3 with WR2 upside in this scenario. The WR2 outcome would come from continued big plays helping him overcome an unfavorable route share.
Scenario 2: Cooper's route share grows to ~85%.
In this scenario, Cooper's historical comparisons averaged 14.8 PPG with 55% attaining WR2 status.
- WR7-12 seasons: 22% (ceiling outcome → sell high)
- WR13-24: 55% (median outcome → hold)
- WR25-36: 21% (floor outcome → buy low)
- WR37+: 2% (outlier floor outcome → buy low)
This scenario is less likely, but I can't tell you by what degree because coaches are unpredictable. A teammate injury could also open the door to this path. So, while it is the less likely of the two scenarios, it still paints a picture of his ceiling if the rookie runs pure.
Cooper would be a low-end WR2 with WR1 upside in this scenario. But he needs significantly more playing time for that upside to materialize.
Bottom Line: Cooper UPGRADES to low-end WR3 territory but has a strong path to WR2 territory with more playing time. I would be willing to sell him at a WR2 price tag today.
 3. Colston Loveland's Production and Utilization are surging
Loveland has scored 18.5 and 19.9 points over the last two games. Over the last three weeks, he has reached a 22%+ target share three times.
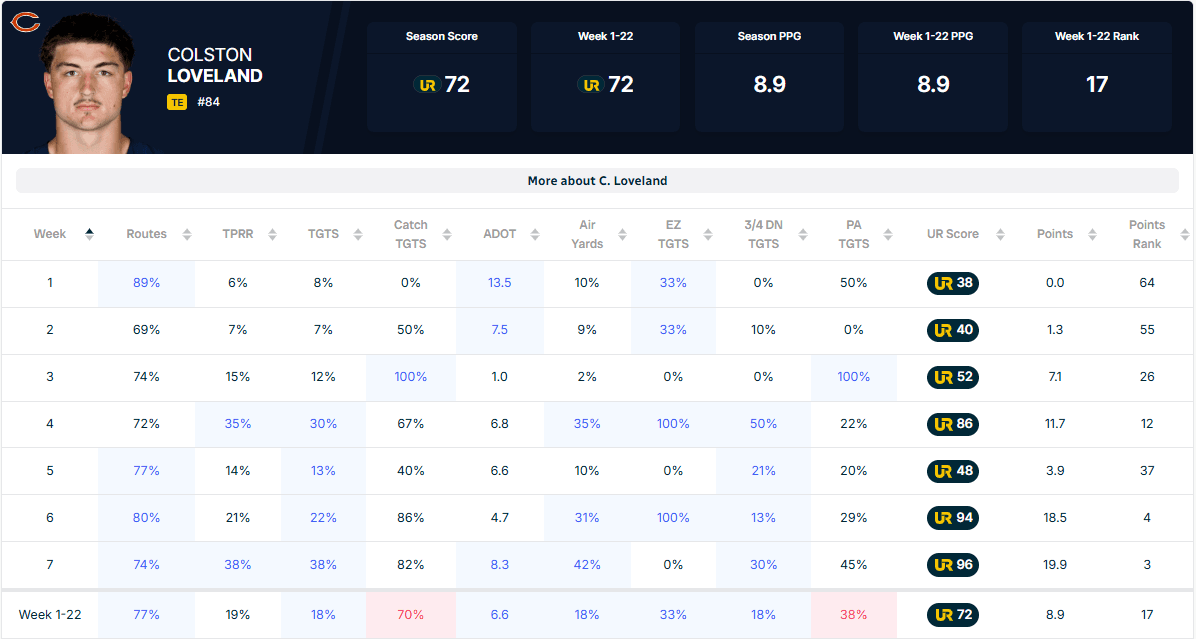
The second-year TE is looking more like what we saw at the end of last year. His Utilization Score over the last four contests is elite (90), and he has a 25% target share. Over that span, he is the TE6 with 13.5 PPG.
Cole Kmet (knee) is out for the season. On the one hand, that could open the door for Loveland to get more playing time. On the other hand, he could be asked to block more—something Kmet did more often—and we could see more WRs on the field, which increases target competition.
Overall, the big-picture takeaway for me is simple: Colston was a great prospect and is showing signs of life. Generally speaking, I want to buy into those situations. How Kmet's injury impacts the offense remains to be seen. At the end of the day, I am not sure it massively changes how we think about Loveland anyway.
The Bears are the No. 7 scoring offense (25.7 PPG) and run the most regulation plays per contest (72.1). Chicago is on pace to run an additional three games' worth of plays vs. the average NFL team.
Furthermore, Burden is the only other player on the team demanding targets (22%). Kalif Raymond has faded (14%), and Rome Odunze is stuck playing on the boundary with the fourth-highest route depth (11.8) among WRs with at least 150 routes. Odunze has a 16% target share.
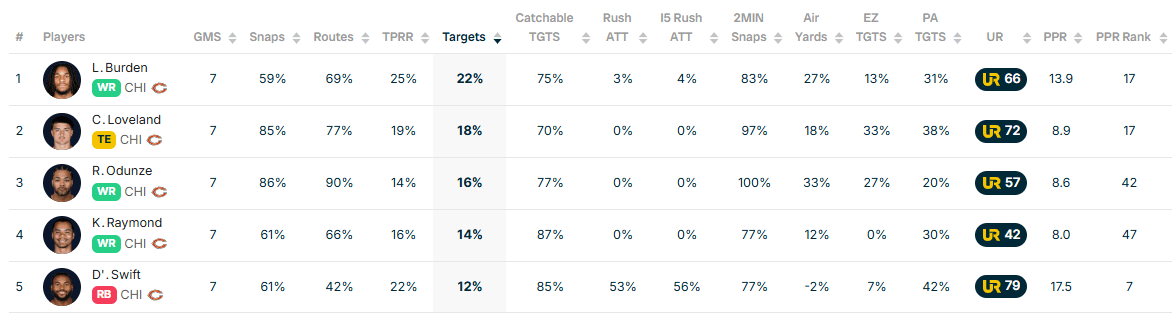
We have a talented young player in a great situation. That should be the takeaway that outweighs all the minutiae.
Since taking over the starting role last year, Loveland now has an 83 Utilization Score over a 12-game sample. His historical comparisons average 12.9 PPG with 77% securing top-six campaigns.
- TE1-3 seasons: 33% (ceiling outcome)
- TE4-6: 40% (median outcome)
- TE7-9: 20% (floor outcome)
- TE10-12: 7% (outlier floor outcome)
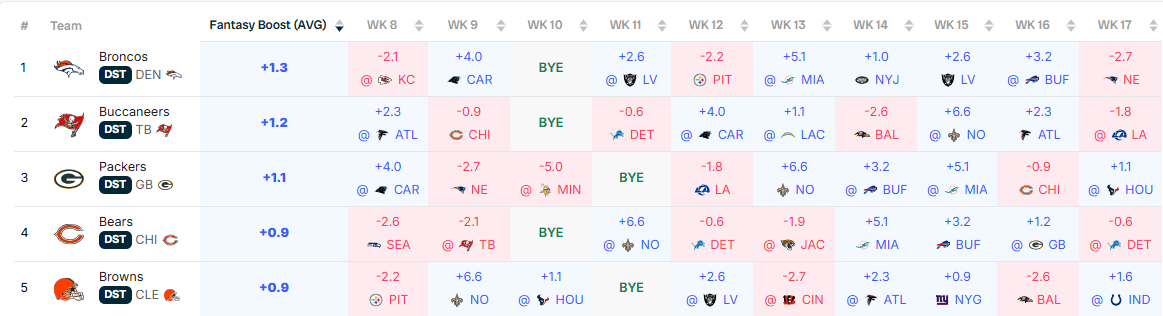
He has a tough Week 8 matchup against the Seahawks (-4.1 PPG), but the Bears have the fifth-best TE schedule for the rest of the year (+1.3 PPG).
Loveland UPGRADES to mid-range TE1 territory and offers high-end TE1 upside.
 4. Ollie Gordon is an RB2 based on historical comparisons
Gordon is averaging 16.2 PPG with a 78 Utilization Score as the starter in four games. Over that period, he has a 74% snap share, 63% rush share, 57% route share, and a 9% target share. He is averaging 17.3 attempts and 2.0 targets per contest.
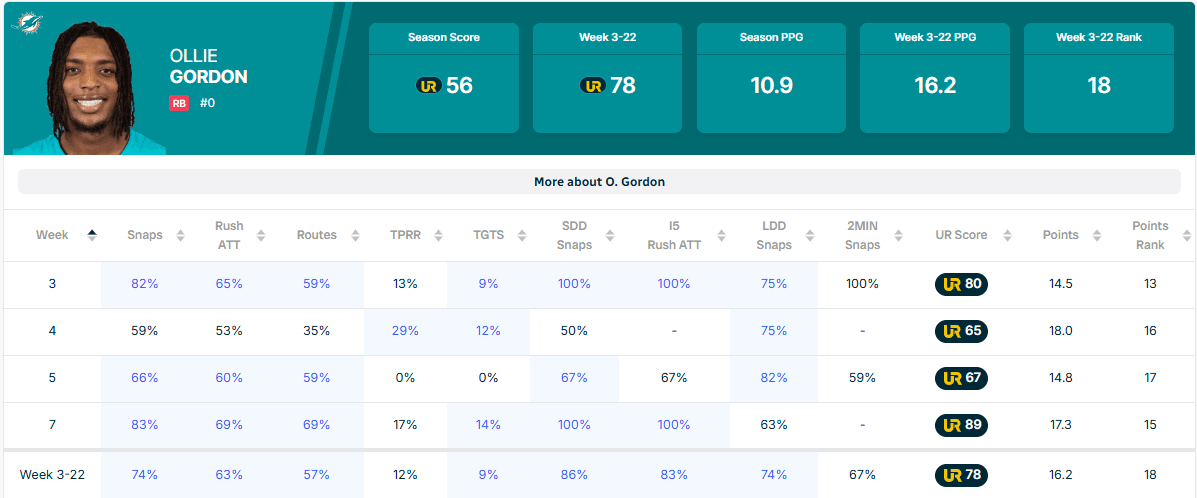
Those numbers might be slightly inflated. In Week 3, Jaylen Wright didn't play, and Wright left Week 7 with a quad injury on the sixth drive. But before that injury, Gordon was firmly in control, with a 75% snap share and a 68% rush share.
The second-year RB has been more than a volume vacuum. He has also been efficient.
- Yards per carry: 4.7 (10th among 32 RBs with 60+ attempts)
- Yards after contact: 3.19 (11th)
- 10-plus yard attempts: 13.9% (6th)
- Missed tackles forced: 20.8% (11th)
The Dolphins rank 30th in scoring (16.3 PPG), and 31st in regulation plays per game (56.2), which is a big concern for Gordon. But they have shown some life in their last two outings, averaging 26 points and 64 plays.
And Miami has decided on their identity: they are a run-focused attack. The Dolphins rank 32nd in dropback rate over expected (-11%). The offensive line is performing well in the run game. Dolphins RBs averaged 1.43 yards before contact (8th).
Gordon gets a tough RB matchup next week against the Patriots (-2.7 PPG), but has the seventh-best schedule for the rest of the season (+0.6 PPG).
Gordon's historical Utilization Score comparisons averaged 14.7 PPG, so we could see some negative regression. Still, most of his comps were RB2s (64%).
- RB1-12: 30% (ceiling outcome)
- RB13-24: 64% (median outcome)
- RB25-36: 6% (outlier floor outcome)
Gordon UPGRADES to mid-range RB2 territory.
 5. Justin Jefferson: The Vikings defense is stealing the show
Jefferson is doing his part, leading Minnesota with a 31% target share and 2.24 YPRR in his four healthy games. Unfortunately, the Vikings' passing attack has lost its air. They rank 29th in passing YPG (181) and are tied for 24th in TDs (1.0).
It's hard to blame the coaching staff. The team is 6-0 and leaning heavily on its dominant defense, which ranks first in EPA allowed per play (-0.21). This development has led to a slow, run-centric attack. The Vikings rank 28th in DBOE (-4%) and rank 26th in seconds remaining on the play clock in neutral situations (7.57).
Jefferson is capable of 9-10 targets per game, but this unique cocktail has kept him in check. He is averaging 7 per game with 83 air yards per contest. Jefferson is still averaging 16.7 PPG but has a Utilization Score of 76.
Historically, his comparisons average 15.0 PPG, with only 26% securing top-12 seasons. The majority of his comps (53%) were WR2s.
- WR7-12 seasons: 26% (ceiling outcome → sell high)
- WR13-24: 53% (median outcome → hold)
- WR25-36: 21% (floor outcome → buy low)
- WR37+: 1% (outlier floor outcome → buy low)
At first blush, Jefferson seems like a good sell candidate. But I am holding/buying.
The upcoming schedule offers a unique blend of great matchups for WRs and offenses that could challenge the Vikings' defense, which could force Kevin O'Connell to open things up.
- DET: +4.2 PPG to WRs (4th); 30.7 PPG (2nd)
- BUF: +8.7 (1st); 32.8 (1st)
- GB: +1.9 (10th); 20.6 (24th)
- SF: -0.8 (20th); 28.1 (3rd)
Jefferson could be the WR1 in fantasy over this four-game stretch. And he gets the Lions and Commanders (+2.0 PPG) in Weeks 15 and 16 in the fantasy playoffs.
Jefferson's Utilization Score says he is a mid-range WR2, but the upcoming schedule says hold my beer. Jefferson is HOLDING STEADY as a borderline WR1 with high-end WR1 upside.
 6. Broncos Backfield Shakeup: Jonah Coleman SZN?
Coleman returned from IR in Week 7 and led the team in snaps (50%), attempts (41%), and routes (34%). He accounted for 100% of the short-yardage snaps and shared long-down-and-distance snaps with RJ Harvey.
The rookie finished the day with a 51 Utilization Score and 8.9 points.
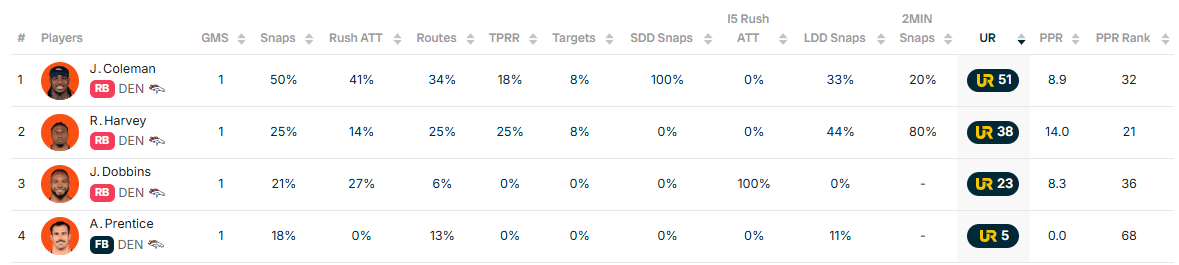
In the first half, Coleman took 100% of the snaps on the second series, but finished with 28% in the first half. In the second half, the team turned to the rookie, who got 74% of the snaps.
Most of his work came with a 7-plus-point lead, so it is hard to tell whether Coleman is emerging as the top option or their four-minute back. Either way, it was a step in the right direction, and J.K. Dobbins and Harvey haven't done much to secure their roles.
Dobbins is averaging 3.4 YPC and only 6% of his attempts have gone for 10-plus yards. Harvey has been a significant factor in the passing game with the second-highest TPRR (33%) in the NFL but averages only 4.0 attempts per game and 3.6 YPC.
There is definitely a world where the Broncos cut this backfield down to two options, with Coleman as the lead early-down back and Harvey as the pass-catching threat.
If that comes to fruition, Coleman would be well positioned to help fantasy teams, thanks to the best remaining RB schedules (+1.3 PPG).
But Coleman will need to handily overtake Dobbins. If he stays in the role we saw in Week 7, it would be an upgrade for the rookie, but not one that will help us hoist fantasy championship banners. Historical comparisons averaged 9.1 PPG, and only 4% became low-end RB2s.
- RB19-24: 4% (outlier ceiling outcome → sell high)
- RB25-36: 23% (ceiling outcome → sell/hold)
- RB37-48: 57% (floor outcome → buy)
- RB49-60: 16% (outlier floor outcome → buy low)
Coleman UPGRADES to high-end RB4 status but could emerge as an RB2 if he displaces Dobbins completely. He is available in 65% of Yahoo leagues and is a PRIORITY WAIVER WIRE target if you need RB help.
JK Dobbins DOWNGRADES to low-end RB3 territory and will plummet to RB5 status with another outing like Week 7.
 7. Josh Jacobs posts an RB1 finish in his first game back
Jacobs handled 54% of snaps, 61% of attempts, and a 17% target share on 43% of routes in Week 7 against the Lions. He finished the day with an 84 Utilization Score and 20.1 fantasy points.

Jacobs played his largest role in third and fourth quarters:
- 1st quarter: 57% snaps, 57% attempts
- 2nd quarter: 41% snaps, 25% attempts
- 3rd quarter: 60% snaps, 67% attempts
- 4th quarter: 59% snaps, 80% attempts
Historically, Jacobs has averaged about 66% of attempts under Matt LaFleur. But injuries affected many of those games. Jacobs will likely push for a 70% snap/attempt role quickly, given how bad the Packers RB room has been.
But the Packers are not the same team Jacobs knew from previous seasons. They are the most pass-happy team in the NFL with a 9% DBOE. So, the rushing pie is smaller.
Jacobs has the No. 3 RB schedule (+1.1 PPG) the rest of the way.
Jacobs is a high-end RB2 with low-end RB1 upside.
8. Utilization Score Underperformers
The Utilization Score is made up of the fantasy data points that have historically correlated the most strongly with future fantasy success. It's similar to, but different from, expected fantasy points. How it differs:
- Accounts for snaps and routes in addition to attempts and targets.
- Accounts for catchable targets and catchable air yards.
- The underlying role accounts for ~75% of a player's Utilization Score.
- Uses fantasy points per game (PPG) as a proxy for talent (i.e., has the player done something with their opportunities). Fantasy PPG is worth ~25% of a player's Utilization Score.
 Nico Collins | WR | Texans
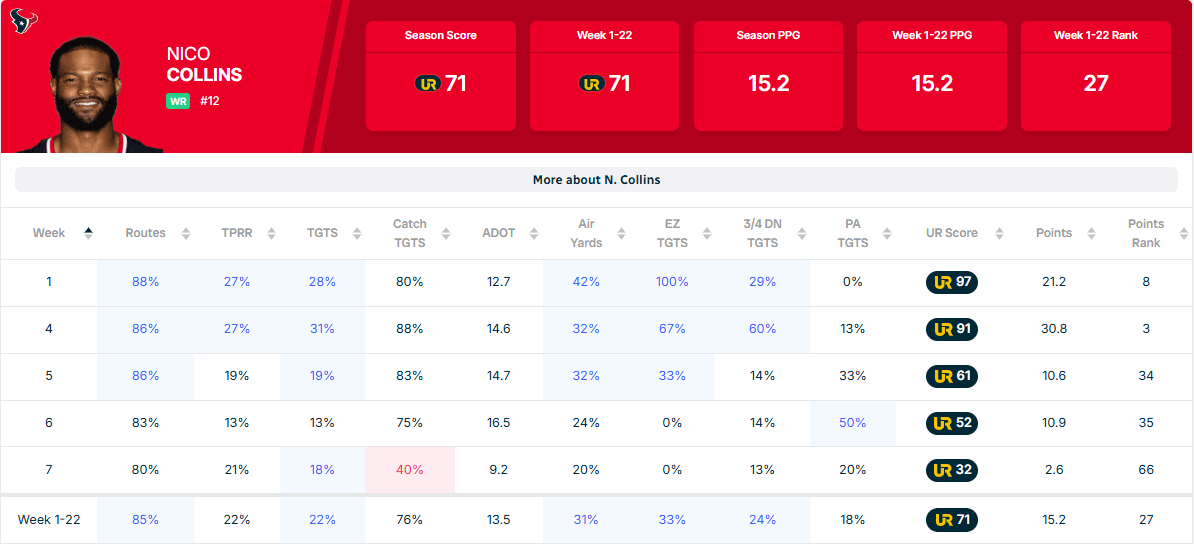
Collins has scored 10.6, 10.9, and 2.6 points over the last three weeks and is now headed into a bye.
That means your local league manager probably isn't too happy with him, and the bye week makes him even easier to move on from.
The team added Marvin Harrison Jr. via trade, but Collins is still by far the No. 1 option on a good passing team. C.J. Stroud is averaging 267 YPG (8th) with 1.57 TDs (16th). Collins has been a strong fantasy option in worse versions of this offense.
- 2024: 17.8 PPG (232 YPG; 1.18 TDs)
- 2025: 14.5 PPG (232 YPG; 1.41 TDs)
His route shares (83% and 80%) have declined over the last two weeks as more options rotate in, but Collins was at 76% in 2024 and 83% in 2025.
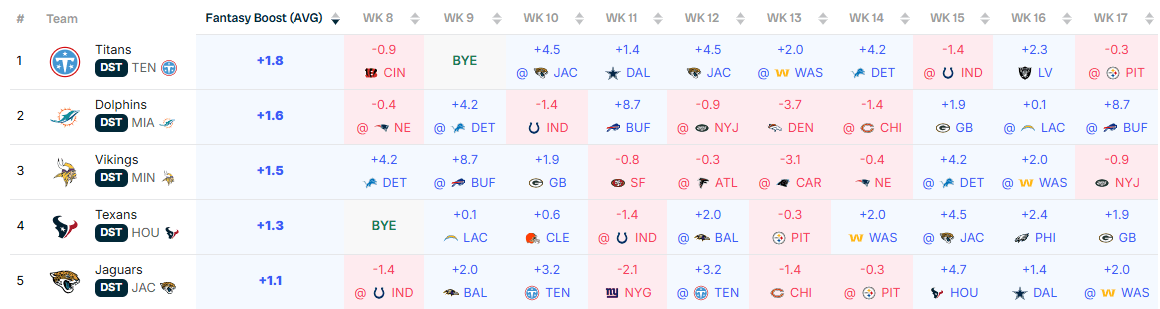
Collins gets the fourth-best schedule for WRs (+1.3 PPG) for the rest of the season.
Collins is less of a bet on his current Utilization Score (71) and more on his historical performance paired with an improved offense.
Collins projects as a low-end WR1 in our rest-of-season model and offers high-end WR1 upside in an improved passing attack. He is a fantastic BUY-LOW option if your local league manager is getting antsy.
Note: For more buy-low options, check out the Utilization Bytes below.
9. Utilization Score: Overperformers
 Cam Skattebo | RB | Giants
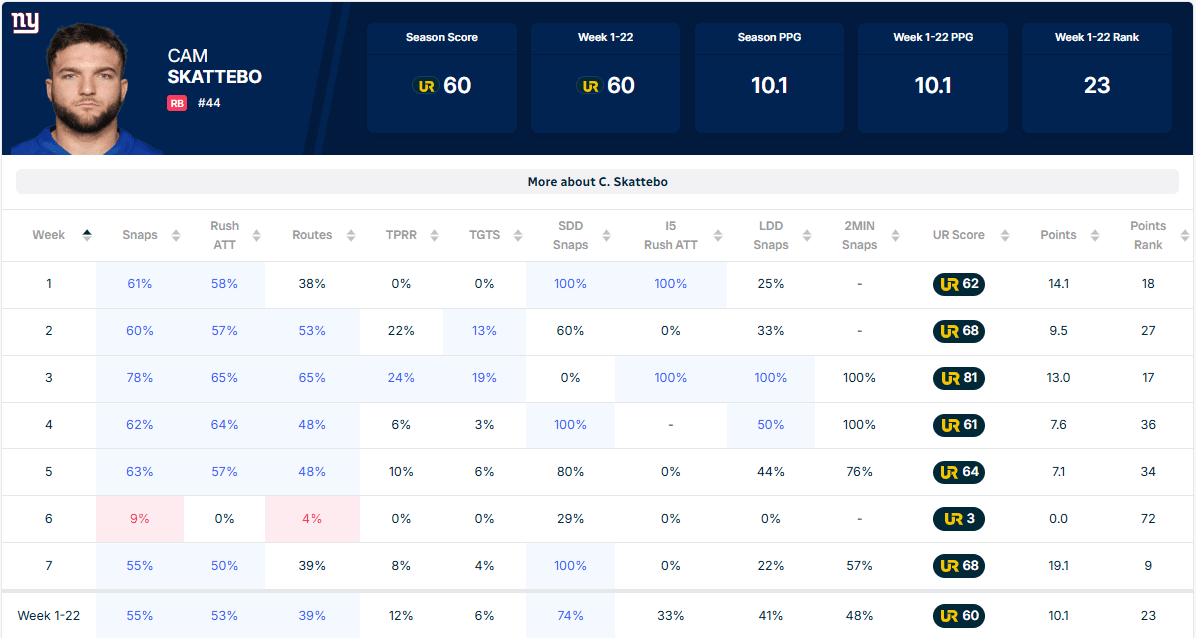
Skattebo regained the RB1 role for New York and scored 19.1 points. But the same underlying problems that plagued him before the Week 6 benching remained. Skattebo wasn't involved in the passing game, with a 39% route share and 4% target share.
He flashed his patented wrecking ball style, breaking four tackles and punishing defenders. But his two long runs came through wide-open holes. I am not trying to take those away from him—the Giants' running game could keep improving. But Skattebo isn't a breakaway RB—he needs a lot of touches to do his thing.
The Giants still used three RBs in Week 7. Plus, they are using Jameis Winston on sneaks in short yardage. Winston handled three designed attempts, including one inside the five-yard line against Houston. Skattebo needs all of that work—his ceiling comes through rushing TDs.
The second-year RB now has a 67 Utilization Score in six games excluding Week 6. His historical comparisons average 12.9 PPG, with most finishing as borderline RB2s (58%).
- RB1-12: 14% (outlier ceiling outcome → sell high)
- RB13-18: 15% (ceiling outcome → sell high)
- RB19-24: 27% (median outcome → sell/hold)
- RB24-30: 31% (median outcome → hold)
- RB31-36: 13% (outlier floor outcome)
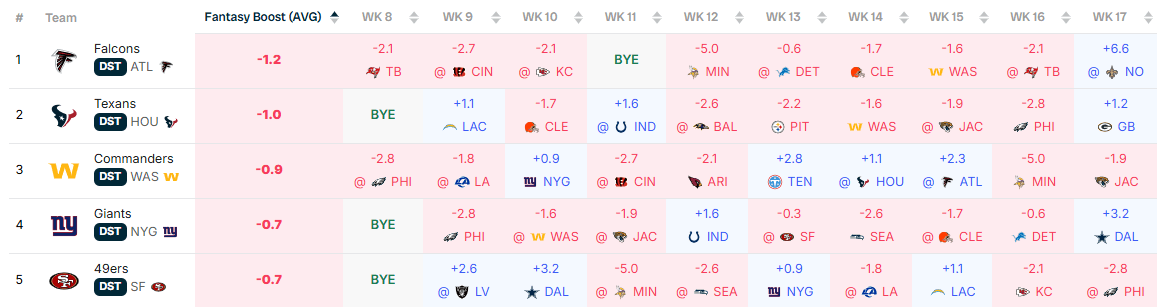
Skattebo has the fourth-hardest schedule for RBs (-0.7 PPG) with only two plus matchups.
Skattebo UPGRADES to high-end RB3 status but is worth shopping around.
10. Waiver Wire Roundup
QB WAIVER WIRE OPTIONS FOR WEEK 8 IN FANTASY
- Sam Darnold | Seahawks: Streamer. Available in 64% of leagues. Second-best schedule over the next four weeks (+3.4 PPG): CHI (+2.3), ARI (+5.4), LV (+2.3), BYE.
- J.J. McCarthy | Giants: Streamer with dual-threat upside. Available in 89% of leagues. Fourth-best schedule for QBs for the month after Week 8 bye (+2.6 PPG): PHI (+1.5), WAS (+7.2), JAX (-0.6), IND (+2.2).
RB WAIVER WIRE OPTIONS FOR WEEK 8 IN FANTASY
- Jonah Coleman | Broncos: Available in 65% of leagues. See No. 6 above.
- Kaelon Black | 49ers: Black has a bye in Week 8, but Christian McCaffrey (thigh) missed two drives. The injury isn't considered serious, but CMC didn't return to his normal role once back. Black played 46% of snaps and handled 52% of rushing attempts. He even took over the two-minute offense, playing and taking all seven reps. Black would be an RB2 with RB1 upside if McCaffrey is out. He is available in 72% of leagues.
- Seth McGowan | Colts: Jonathan Taylor saw his smallest workload of the season: 69% snaps, 56% attempts, 37% route share. This follows reports that multiple teams have inquired about acquiring Taylor in a trade. The Colts (2-5) are in the middle of a three-game evaluation period that began against Minnesota. McGowan is the Colts' No. 2 and would take on a significant workload if Taylor is moved. While the offense is uninspiring, they have the third-best RB schedule over the next five games (+1.7 PPG): JAX (-1.9), DAL (+3.2), MIA (+5.1), HOU (+1.1), NYG (+0.9). McGowan would be a low-end RB2 with mid-range RB2 upside if Taylor gets traded. McGowan is available in 93% of Yahoo leagues.
- Dylan Sampson | Browns: Sampson returned from IR in Week 7 and split snaps with Quinshon Judkins. Sampson operated as a change of pace on the ground with a 21% rush share, but led the team on passing downs. He posted a 42% route share with 9% of the targets, playing all 12 of the two-minute offense snaps. Sampson finished the day with 10.7 points and a 49 Utilization Score. He has the fourth-best schedule over the next four games (+1.8 PPG): PIT (-2.2), NO (+6.6), HOU (+1.1), BYE. Sampson UPGRADES to mid-range RB4 status and is available in 92% of Yahoo leagues.
- Could Return in Week 8: Jadarian Price - IR (31% available).
- Tier 1 Handcuffs: Emmett Johnson (79%), Brian Robinson (68%), Kaelon Black (72%), Seth McGowan (93%), Chris Rodriguez (76%), Samaje Perine (88%).
- Longview Players Your Leaguemates Could Cut: Emmett Johnson (79%). He was the sixth-most-dropped RB in early waiver-wire action.
- IR Stash: Jonathon Brooks (60%). Expected to return between Week 9 and 11. Panthers' offense is much improved. Probably only a Tier 1 handcuff at this point, given how well Hubbard is playing.
WR WAIVER WIRE OPTIONS FOR WEEK 8 IN FANTASY
- Antonio Williams | Commanders: Terry McLaurin is out for the season, and Williams is in line for a much larger role. After McLaurin exited in Week 6, he had an 80% route share. The Round 3 rookie was widely viewed as an underneath slot option coming out of Clemson, but he has played outside 66% of snaps. His 10.6 average route depth doesn't suggest an underneath merchant. Williams UPGRADES to borderline WR4 territory and offers WR2 upside. He is available in 92% of Yahoo leagues and is a PRIORITY WAIVER WIRE target.
- Makai Lemon | Eagles: The Eagles receiving corps is hurting, which opens the door for Lemon to show what he has on Monday Night Football. The Eagles offense is stuck in reverse, but this Round 1 WR talent could make noise down the stretch. He should not be available in deep formats. Lemon is a WR5 with WR3 upside and is available in 63% of Yahoo leagues.
- Ja'Kobi Lane | Ravens: Lane saw his highest route share (75%), slightly edging out Rashod Bateman (73%) in Week 7. The Round 3 NFL pick is tracking to overtake the WR2 role in an offense that could boom when Lamar Jackson returns. Lane is a strong red-zone weapon on a team that needs help, with Bateman and Mark Andrews struggling. Lane has the fourth-best WR schedule over the next four games (+2.5 PPG): BUF (+8.7), JAX (+4.5), LAC (+0.1), CAR (-3.1). Lane UPGRADES to WR4 territory and is available in 83% of leagues.
- Caleb Douglas | Dolphins: Douglas returned to action in Week 7 and scored 21 points thanks to two TD receptions on three targets (14%). He had the second-highest route share (81%). Volume could be a problem in a run-first offense with a scrambling QB, but the Round 3 rookie is top of the depth chart. Douglas has the third-best WR schedule over the next month (+2.2 PPG): NE (-0.4), DET (+4.2), IND (-1.4), BUF (+8.7). Douglas is a boom-bust WR5 with WR3 upside and is available in 90% of leagues.
- Travis Hunter | Jaguars: The Brian Thomas trade rumors continue to swirl. If he moves, Hunter could get a larger role. Hunter's contingency upside would also get a boost with BTJ gone—he could provide WR2 production if forced into a starting role. Hunter is a boom-bust WR6 with WR2 upside in a clean runout. He is available in 91% of leagues.
- SICKO STASHES: Treylon Burks (99%)
- Longview Players Your Leaguemates Could Cut: Jakobi Meyers (56%), Brian Thomas (52% - trade candidate)
- IR Stashes: Jordyn Tyson (51%), Alec Pierce (52%)
TE WAIVER WIRE OPTIONS FOR WEEK 8 IN FANTASY
- Chig Okonkwo | Commanders: Okonkwo has 24% and 21% target shares over his last two games—games where Stefon Diggs or McLaurin were out/injured. He scored 10.0 and 13.9 points. Okonkwo is in line for more targets with McLaurin out, but he has the third-hardest schedule over the next month for TEs (-1.7 PPG): PHI (-0.8), LA (-6.1), NYG (-2.2), CIN (+2.2). Oknokwo UPGRADES to high-end TE2 territory and is available in 83% of leagues.
- Mason Taylor | Jets: Taylor has 21% and 23% target shares over the last two games. In Week 7, he boomed for 25.2 points, scoring on both of his contested end-zone targets. Taylor's route participation rate (65%) since returning isn't great. With Round 1 pick Kenyon Sadiq also on the roster, the playing time will likely never reach 80%, but the Jets' 2025 Round 2 pick is showing signs of life. Taylor gets an assist from the schedule in the short term with two of the best TE matchups in Weeks 8 and 9: LV (+4.9 PPG), KC (+5.3 PPG). Taylor is a low-end TE2 with upside and is available in 99% of leagues.
- Don't have to hold through bye week: Juwan Johnson (routes in decline, and Jordyn Tyson could return after bye).
- Longview Players Your Leaguemates Could Cut: Kenyon Sadiq (77%)
- IR Stash: Terrance Ferguson (85%)
Utilization Bytes
Quarterbacks
- Tyler Shough | Saints: Shough now ranks third in designed rushing attempt share inside the five-yard line (40%). He ranks 14th in passing YPG (246) and is tied for 9th in passing TDs per game (1.86). People can knock Shough as an NFL talent all they want, but we are playing fantasy football—and he offers a unique blend of scoring outs that will keep him relevant. Shough is HOLDING STEADY as a low-end QB1 despite his 14.8 points in Week 7.
Running Back
- Bam Knight | Cardinals: Knight worked in tandem with Tyler Allgeier again in Week 7, handling 33% of the rushing attempts on a 53% snap share. He led the way with a 48% route share and 10% target share, scoring 9.3 points. Knight is a low-end RB3 until Jeremiyah Love returns.
- Blake Corum | Rams: Corum has scored 16.2, 14.0, and 17.1 points over the last three games with the Rams offense not in shootout mode. Kyren Williams is still the RB1, but Corum is playing great. Among 39 RBs with at least 50 attempts: 5.9 YPC (7th), 14.1% 10+ yard attempts (5th). Corum is a fragile RB given his dependency on game scripts, but he is running hot on a good offense. Corum is a mid-range RB3 with contingent RB1 upside if Williams ever misses time.
- Bucky Irving | Buccaneers: Irving scored 24 points in Week 7 despite resting in the fourth quarter in a blowout victory. Before that: 75% snaps, 67% attempts, 46% routes. Sean Tucker stole one early attempt inside the five-yard line, but Irving is set up for a great finish. He gets the No. 2 RB schedule (+1.2 PPG) from Week 8-17. Irving has a 78 Utilization Score. His comps average 15 PPG, with 36% reaching RB1 territory. Irving is HOLDING STEADY as a mid-range RB2 with RB1 upside.
- Chase Brown | Bengals: Brown only managed 9.8 points in Week 7 despite returning to an elite snap share (75%). The good news: it appears that Brown's Week 5 fumble didn't cost him the starting job. The bad news: Brown isn't slamming the door on Samaje Perine, continuing to underwhelm. Brown is averaging 12.5 PPG with an 81 Utilization Score. His historical comps average 15.8, with 65% notching RB1 seasons. We have seen Brown do this in the past—hopefully he can flip the switch soon. Brown DOWNGRADES to mid-range RB2 status but offers RB1 upside.
- Jaylen Warren | Steelers: In two games with Rico Dowdle back in the fold, Warren is averaging 13.3 points with a 77 Utilization Score. He has handled 65% of the attempts and garnered a 10% target share on a 48% route share. He has 15 attempts and 3.5 targets per game. Warren continues to look amazing: 5.5 YPC (2nd), 3.7 yards after contact (5th), 10.8% 10+ yard attempts (13th), 24.5% missed tackles forced (7th), 1.83 YPRR (4th). His historical comparisons average 14.9 PPG, with most (62%) finishing as RB2s. And 33% secured RB1 campaigns. Warren is HOLDING STEADY as a mid-range RB2 with RB1 upside.
- Jordan Mason | Vikings: Mason returned to action in Week 7 and managed 6.8 points. He led the backfield with a 63% snap share, 63% rush share, and 47% route share. He was targeted 9% of the time. But Aaron Jones left the game after re-aggravating his MCL injury, which is reportedly not serious (day-to-day). Before Jones left, Mason had a 55% snap share. Mason is a mid-range RB3 with RB2 potential if Jones misses time—Minnesota has the 8th-best RB schedule (+0.6 PPG).
- Tony Pollard | Titans: Pollard erupted for 36.5 points against the Browns. Pollard is Tennessee's clear early-down RB, with a 76% share this season. And over the last three games, he has handled 82%, 90%, and 86% of the totes. Tyjae Spears didn't play in Week 7, but he is the passing-down option. Michael Carter took his reps. Pollard has a 66 Utilization Score. His historical comparisons average 12.6 PPG, which aligns with his 12.5. Most were low-end RB2s to high-end RB3s (55%). Pollard is a SELL-HIGH candidate coming off of what will likely be his highest output of the season by far in a low-scoring Titans offense.
Team Trends To Monitor For Week 8
With at least five weeks of data, it's a good time to examine team-level trends that affect fantasy production. You can find the data across all 32 NFL teams in the Team Styles tab of the Utilization Report tools.
Redzone Drive Rate vs. Touchdown Drive Rate: Percentage of drives that reach the red zone versus how often the team is scoring a touchdown per drive. Large deltas indicate room for positive or negative regression. The NFL average delta is ~5-6%, and the average team reaches the red zone on 29% of drives.
Offenses that reach the red zone a lot and have room for more TDs:
- Bears: 13% (40% v 27%)
- Raiders: 12% (36% v 24%)
- Texans: 10% (33% v 23%)
Dropback Over Expected (DBOE): How often teams pass the ball compared to their peers when considering the score differential over the last seven weeks:
- Packers: 8%
- Cowboys: 6% (Pre MNF)
- Rams: 6%
- Bengals: 5%
- Panthers: 5%
—
- Falcons: -7%
- Titans: -7%
- Dolphins: -14%
Neutral Playclock: Teams that are leaving more or less time on the play clock when the score is within three points (neutral situations). The NFL average is 8.3 seconds.
- Browns: 11.47
- Cowboys: 11.45 (Pre MNF)
- Chargers: 11.06
- Patriots: 10.41
- Chiefs: 10.38
—
- Dolphins: 6.84
- Steelers: 6.84
- Giants: 6.83
- Commanders: 5.52
Play action pass rate: Teams that are utilizing play action the most per dropback over the last five weeks, which adds value to WRs and TEs on a per-route basis in fantasy:
- Bills: 38%
- Bears: 35%
- Vikings: 33%
- Lions: 33%
- Chiefs: 33%
- Panthers: 32%
—
- Steelers: 19%
- Bengals: 19%
- Saints: 17%
- Eagles: 16% (Pre MNF)
Personnel: When teams deploy more heavy personnel, with extra TEs and RBs on the field, the pass catchers who remain on the field face less target competition. For example: WRs saw a 29% boost in PPR points per route with two WRs on the field vs. three WRs over the last three seasons. Game scripts can impact this data over small samples.
21 Personnel (2 RB, 1 TE, 2 WR) – large boost
- 49ers: 35%
- Chargers: 27%
- Dolphins: 26%
- Vikings: 16%
- Giants: 14%
- Raiders: 13%
- Seahawks: 13%
22 Personnel (2 RB, 2 TE, 1 WR) – large boost
- Giants: 19% (21 + 22 = 33%)
- Raiders: 14% (21 + 22 = 27%)
- 49ers: 10% (21 + 22 = 45%)
- Seahawks: 9% (21 + 22 = 24%)
- Vikings: 8% (21 + 22 = 24%)
- Chargers: 8% (21 + 22 = 35%)
11 Personnel (1 RB, 1 TE, 3 WR) – negative boost
- Eagles: 77% (Pre MNF)
- Titans: 74%
- Cowboys: 73% (Pre MNF)
- Browns: 72%
- Saints: 69%
12 Personnel (1 RB, 2 TE, 2 WR) – small boost
- Raiders: 48%
- Bengals: 45%
- Bears: 33%
- Chiefs: 32%
- Colts: 31%
13 Personnel (1 RB, 3 TE, 1 WR) – large boost
- Rams: 34% (12 + 13 = 44%)
- Bills: 29% (12 + 13 = 49%)
- Cardinals: 27% (12 + 13 = 34%)
- Bears: 18% (12 + 13 = 51%)
- Ravens: 15% (12 + 13 = 43%)
Offensive Lines: Pressure rates are huge for QBs. Most signal callers who are constantly harassed will struggle to find consistent fantasy value. QBs partially own pressures, so it isn't all an offensive line issue. The NFL average pressure rate is 36% over the last three seasons. Yards before contact matters for RBs. Backs who get better blocking have a better chance to thrive in fantasy. RBs also impact this number with their vision, acceleration, and elusiveness. The NFL average yards-before-contact on RB attempts is 1.28 over the last three years. It is important to remove QBs since scrambles often come with defenders' backs turned and can inflate these numbers.
Pressure Rate Allowed:
- 3-Year NFL Average: 36%
- 2026 NFL Average: 36%
- Falcons: 28%
- Cardinals: 29%
- 49ers: 30%
- Rams: 31%
- Bengals: 31%
- Lions: 31%
- Jaguars: 31%
—-
- Seahawks: 41%
- Browns: 41%
- Patriots: 42%
- Eagles: 43%
- Panthers: 44%
- Dolphins: 45%
- Chargers: 46%
Average Yards Before Contact Rushing
- 3-Year NFL Average: 1.28
- 2026 NFL Average: 1.17
- Bills: 2.37
- Rams: 1.98
- 49ers: 1.68
- Steelers: 1.64
- Chiefs: 1.57
- Lions: 1.51
—
- Saints: 0.83
- Packers: 0.82
- Eagles: 0.72 (Pre MNF)
- Raiders: 0.70
- Jaguars: 0.67
- Seahawks: 0.66
Defensive Tendencies:
Pressure Rate: Defenses with high pressure rates can dramatically impact QB performance. Under pressure, QB statistics become much more unstable and decline at the macro level.
- 3-Year NFL Average: 36%
- 2026 NFL Average: 36%
- Vikings: 48%
- Seahawks: 44%
- Broncos: 42%
- Falcons: 41%
- Browns: 40%
—
- Colts: 30%
- Titans: 30%
- Buccaneers: 30%
- Giants: 29%
- Saints: 29%
Pass Blitz Rate: Defenses that blitz often can impact how often TEs and RBs run routes. Against heavy blitz teams, they can remain in to block more often. Teams that get pressure without blitzing can be tough to pass against.
- 3-Year NFL Average: 26%
- 2026 NFL Average: 30%
- Vikings: 69%
- Commanders: 43%
- Patriots: 41%
- Jets: 41%
- Buccaneers: 40%
- Giants: 40%
—
- Texans: 21% (strong pressure rate of 37%)
- Raiders: 22% (strong pressure rate of 37%)
- Seahawks: 22% (high pressure rate of 44%)
- Falcons: 22% (high pressure rate of 44%)
- Colts: 22% (mid pressure rate at 29%)
- Dolphins: 22% (solid pressure rate of 35%)
- Bengals: 17% (strong pressure rate of 37%)
Man Coverage: Targets skew toward the top WR options against man coverage, while TE and RB opportunities decline at the macro level. Of course, there are exceptions for elite TEs. Also, many teams that utilize man concepts have a shut-down corner, which can be problematic for WRs—especially if the CB shadows. Scrambling QBs also benefit from man coverage. When defenders turn their backs, QBs can tuck the ball and run. And it can take defenders longer to realize it is happening (i.e., Jayden Daniels vs. the Giants in Week 5).
- NFL Average in 2026: 21% (Trending down from previous seasons)
- 2025: 24%
- 2024: 27%
- Browns: 43% (Denzel Ward. Will shadow.)
- WR units: +0.6 PPG boost (13th-best matchup)
- Patriots: 37% (Christian Gonzalez. Will shadow.)
- WR Units: -0.4 PPG (18th)
- Bears: 31%
- WR Units: -1.4 PPG (23rd)
- Rams: 30% (Trent McDuffie. Sometimes shadows.)
- WR Units: -0.7 PPG (19th)
- Giants: 29% (Deonte Banks. Will shadow.)
- WR Units: -2.1 PPG (25th)
- Bengals: 29% (DJ Turner II. Will shadow)
- WR Units: -0.9 PPG (21st)
Zone Coverage: Targets spread out against heavy zone teams. RBs and TEs get more involved, while WR targets tend to take a bit of a hit. There are exceptions. Underneath, WRs can benefit from zone.
- NFL Average in 2026: 74%
- Seahawks: 90%
- QB: -6.7 PPG
- RB: -2.6 PPG
- WR: -5.2 PPG
- TE: -4.1 PPG
- Vikings: 85%
- QB: -6.4 PPG
- RB: -5.0 PPG
- WR: -4.6 PPG
- TE: -3.6 PPG
- Cardinals: 83%
- QB: +5.4 PPG
- RB: -2.1 PPG
- WR: +1.3 PPG
- TE: +2.1 PPG
- Buccaneers: 82%
- QB: -3.0 PPG
- RB: -2.1 PPG
- WR: -4.8 PPG
- TE: +1.3 PPG
- Steelers: 81%
- QB: -2.7 PPG
- RB: -2.2 PPG
- WR: -0.3 PPG
- TE: -2.9 PPG
MUG Looks: We are seeing more defenses aligning in all of the gaps with six-plus defenders in the box. This isn't necessarily new—it was popular about ~10 years ago—but offenses are struggling with it in 2026. It can confuse blocking assignments, and the QB and o-line must identify which players are coming or dropping into coverage. It adds another layer of movement on top of the safeties rotating post-snap, which can create hesitation. That can lead to more pressures, sacks, and turnovers.
The Vikings have been dominant with this look in 2026, so more teams are naturally trying it. The Buccaneers derailed the Cowboys' and Panthers' offenses with these looks. I'm collecting this data, along with which QBs handle it best/worst.
Players Mentioned in this Article
Presented by


Published Updated