What is Pass Rate Over Expectation? - How To Use PROE In Fantasy Football
I love watching e-sports.
I know. The guy who breaks down fantasy football stats likes watching other people play video games. Go figure.
Anyway, the action is mesmerizing. Seeing “Faker,” the LeBron of League of Legends (or MJ, depending on who’s your GOAT), blackout on Galio to secure his fifth title at Worlds was like watching a live sporting event. The poise amidst the chaos when the stakes couldn’t be higher is inspiring.
However, as a fan, the mayhem can be hard to follow.
Football isn’t much different. There’s so much happening in real time that it’s hard to process everything, everywhere, all at once. Replays help. But the underlying assumption is that the result (a catch, a run for three yards, etc.) was the team’s intent all along. And yet, we know audibles happen often. So, having a stat like a pass rate over expectation (PROE) can help us distinguish between offensive design and defensive constraints.
The Definition of Pass Rate Over Expectation
“PROE measures a team’s passing rate relative to the game situation.”
Run-pass ratio is like the analog version of PROE. Sure, dividing total attempts from the QB by totes and you get a sense of an offense’s playcalling from a totality standpoint. But look at how many inputs you need to calculate it. There are just two. Last I checked, you need a few more elements to capture the context surrounding any play. Let’s use the defending Super Bowl champs as an example.
Of course, in the moment, everybody (except for Bucs’ fans and opposing fantasy managers) was excited to see the eventual rushing king rip off an explosive play. There had only been two other runs like it by Week 4. But let’s think about the game situation for a bit.
The Eagles were down multiple scores and only had a half to go. Plus, they were on their side of the field. Conventional wisdom would suggest a pass. Except the Eagles have a particular set of skills.
Their line is perennially one of the best. The threat of Jalen Hurts can change any defense’s calculus. Plus, clearly, that No. 26 is a problem with the ball in his hands. Those factors allow Philadelphia to disregard any standard approach to the game despite our expectations.
Now, let me clarify. I’m not saying every circumstance requires a QB dropback. If anything, I prefer teams to lean into their strengths. It can be risky at times, but worth the reward from both real and fantasy perspectives. The Bucs showed us this in Week 18.
To be fair, I think we all knew Baker Mayfield was going to get Mike Evans the ball. Shoot, the Saints’ secondary probably knew, too. Regardless, the outcome was magical. Evans made history. However, there’s a reality somewhere in the multiverse where Tampa closes out the regular season in embarrassing fashion.
Alontae Taylor could’ve played the route tighter. The ball might have slipped through Evans’s fingers. A tipped ball turning into an interception isn’t an outlandish ending. And, given the game state (deep in Bucs’ territory, eight-point score differential, and only second remaining), Tampa’s prospects of a win and career-defining accolade had the potential to go the other way. Put another way, taking a knee or running the ball would’ve made more sense.
OK, let’s bring the conversation back to run-pass ratio. Or, in other words, the metric where only if a team runs or passes is worth considering. But we just saw context matters. So, if we want to adjust how we measure a team’s playcalling, quantifying the other pertinent elements can help set expectations.

Surprise! We’ve got another “x over expected” stat. However, in this case, we’re looking at when we should anticipate a team throwing the ball. Intuitively, whether or not they’re controlling or trailing in a game might influence their decision. Data from 2024 bears out this idea. As an offense increases its lead, the expected pass rate (xPR) decreases. The tropes of “bleeding the clock” and “slowing the game down” have been reshaped into stats. And we can layer in other critical components to a play to more accurately define our predictions.

I’d assume a team trailing on fourth down would throw the ball rather than hand it off to their RB. Conversely, any reasonable OC would protect their lead by pounding the rock. But things like down, yards to go, or location of the snap can shift xPR. But, ultimately, we have a process of gauging what teams “should” do. Comparing what happened to their projection gets us PROE. Let’s go back to Evans getting to 1,000 yards and start with the factors surrounding the play.
- It was first down.
- The Bucs were up by eight points.
- There were 36 seconds left in the fourth quarter.
By the charts, I’d put Mayfield’s xPR somewhere around 50.0%. But we haven’t weighed the importance of the clock yet. All he had to do was kneel! Anyway, the lack of time dropped the anticipation of a pass down to 7.1%. The difference between Mayfield helping Evans get into the record books and his xPR is PROE.
- Expected Pass Rate: 7.1%
- Result: (A Pass) 100.0%
- Pass Rate Over Expectation: 100.0% - 7.1% = 92.9%
The result is a binary outcome. Either a QB passes the ball (100.0%) or opts to run it (0.0%). So, like with CPOE, we can grade the decision to do either on a curve. The chaos of a big play doesn’t seem as random. Barkley was going to get the ball because the Eagles prefer to run the ball. Nothing was going to stop Mayfield from keeping Evans’s streak alive. And with a way to cut through the noise, we can measure each team’s playcalling inclinations before they even take the field.
Why does PROE Matter?
The NFL is still a pass-oriented league. Admittedly, the product isn’t as high-flying as it was five years ago. Still, QB play drives offenses. Or phrased differently, more passes means more interest (real or fantasy).
So, by extension, if I looked at the top-five teams using just run-pass ratio, I should find squads worth investing in next year.
- Cincinnati: 63.2%
- Cleveland: 62.8%
- Las Vegas: 62.6%
- NY Jets: 62.6%
- Seattle: 60.8%
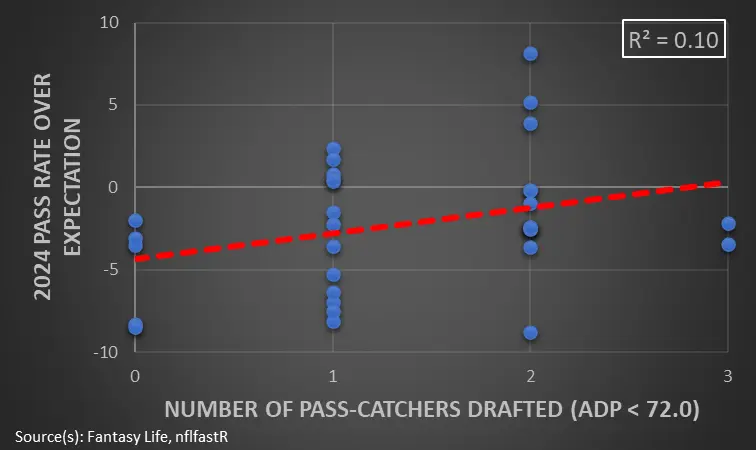
You can view this list through the lens of each team’s 2024 personnel or the units each will field in ’25. The takeaway is still the same. Only one or two offenses have pass-catchers warranting early-round consideration. Besides, we can see why most are on the list.
Seattle’s the only franchise that didn’t allow more than 23.0 PPG. Game script (i.e., something that’s likely to change) had a hand in play-calling decisions. Accordingly, a metric emphasizing intent would serve as a better guide.

Interestingly, two teams from our previous list dropped down a few pegs. Their replacements, the Chiefs and Vikings, aren’t shockers. Both Patrick Mahomes and Sam Darnold averaged top-10 marks in dropbacks per game, but here’s the kicker—their defensive units allowed less than 20.0 PPG. Simply put, we can’t look at raw volume. And when we reframe our approach and apply a fantasy perspective, we can visualize a critical connection.

Despite the recession in passing games over the last few years, QB output still accounted for 64.6% of the offensive yardage produced in 2024. However, throwing to catch up to your opponent isn’t as impactful when trying to correlate to fantasy scoring. It has to be part of the offensive DNA. Or, when your QB does let the ball fly, they do it efficiently. But now, let’s find a couple of ways to apply PROE and build better rosters.
How Can You Use Pass Rate Over Expectation in Fantasy?
Knowing each team’s PROE gives us a top-down view of their offense. Based on the last chart, we can jump from PROE to passing yards and, subsequently, the players likely on the other end of the throw. Drafters have already caught onto this idea based on early-round ADPs.
However, using last year's results to project the next can be disastrous. I discussed this when digging into the Cowboys’ EPA per play without Dak Prescott. We should expect an improvement in ’25 with Prescott healthy. A similar concept applies to PROE.
“More passing isn’t just a schematic shift but a philosophy shared by the head play caller and the quarterback.”
Each QB has their style, and (good) coaches build their scheme around them. But continuity is key. Nobody is expecting Joe Burrow to operate a low-volume aerial attack. Conversely, watching Jared Goff sling it more than 35 times a game might make fans more nervous than excited.
Now, we can flow our assumptions about pass-game aggression to the receivers. And depending on their relative cost, we know who to value more. I’ll use our Player Comparison tool to showcase an example.

By target share, Tee Higgins and DeVonta Smith are the secondary options in their respective offenses. There’s no doubt about who I’d draft between the two. But I’ll make the case for Smith. He’s averaged more yards per route run than Higgins in three straight years. Last year was the first time Smith had missed more than one game in a single season.
However, the Bengals’ WR2 averaged nearly three more targets per game than Smith (9.1 vs. 6.9). And critically, we know Burrow’s penchant for continuing to throw in the red zone. While Smitty watches yet another Tush Push from the sideline, Higgins gets six points, highlighting the importance of understanding PROE as a tiebreaker.
In either case, we know those teams won’t drastically change in 2025. But let’s use the idea of a QB’s preferences driving PROE to find an offense on the upswing. With that perspective in mind, Trevor Lawrence sticks out.
- (Jacksonville PROE) 2021: -2.0%
- 2022: 0.0%
- 2023: 3.0%
After a disastrous rookie season, Lawrence’s dropbacks picked up in consecutive years. But in 2024, Jacksonville slid back to -2.0%. He now has former Bucs OC Liam Coen as his head coach. For reference, that’s the coordinator who greenlit a pass to Mike Evans with 36 seconds left in the game.
Anyway, if Lawrence prefers a heavy-dropback-oriented offense and has a similarly-minded coach, the beneficiary of more passing volume isn’t hard to find.
Brian Thomas was turning heads with Mac Jones as his QB. Now, he’ll get a full season of Lawrence and a competent play caller. Of the 29 WRs to earn more than 20.0% of their team’s targets, the former LSU Tiger ranked third in YPRR while averaging a whopping 6.5 yards after the catch per reception. Lawrence’s lack of mobility should keep him in the middle class of fantasy QBs. But regressing to his career-average PROE of 1.0% can boost Thomas’s ceiling into the top five for 2025.