What Is CPOE? - Grading a Quarterback's Accuracy on a Curve
I always appreciated teachers who graded on a curve.
To be clear, I was (mostly) a good student throughout college. UC’s library and a small conference room on the main floor of Baldwin Hall were frequent spots for my friends and me to study. I worked to get high marks on every exam. But a few curveball problems kept me from meeting my expectations. However, by adjusting my score based on the performance of my peers, I was never too far off the mark.
Completion percentage over expected (CPOE) works similarly.
A throw can have one of three immediate outcomes (caught, dropped, or intercepted). They’re simple to track and compare over time. Yet, each lacks context. We don’t know if the pass was short or attempted on third down. By the basic numbers, all attempts are the same. But we know that’s not the case.
So, by applying in-game factors, we can also start to grade a QB’s accuracy on a curve.
The Definition of CPOE
“CPOE measures a QB’s completion percentage relative to the types of throws they make.”
Subjectively, most people should be able to get behind this idea. It’s the genesis of armchair quarterbacking. I’ll use Peyton Manning as a (derogatory) example.
First off, Steven Ruiz’s step-by-step analysis is on point. Manning’s real-time processing gave him an edge after his arm couldn’t. But I can hear the casual fans already.
“Well, I could do that.”
Sure! Most could complete a three-air-yard pass to a receiver without a defender within five yards of them. Let’s forget about Tyrone Crawford bursting past Ben Powers inside two seconds after the snap, forcing Manning to shuffle up in the pocket. Elijah Wilkinson wasn’t going to hold up much longer in protection, either. The point is, though, that we inherently assign difficulty based on depth.
We’d expect any QB to complete that throw. Yes, I countered the theoretical reductive criticism with trench warfare. But outside of an inaccurate attempt, there weren’t any factors limiting a completed pass. It was a (relatively) easy throw. However, if a QB looks farther downfield, they’re turning up the degree of difficulty.
I didn’t have Jake Browning hitting a game-tying TD pass to the corner of the goal line off his back foot on my bingo card. Justin Jefferson didn’t, either. But take the name of the QB out of the equation. The throw by itself was difficult. It was (semi-under) thrown to the sideline, with at least one defender in range. Those two elements alone are tough enough. Now, apply the same context to Browning as we did to Manning.
Patrick Jones instantly knifes through Cincinnati’s offensive line (like everyone else), putting Browning on the move. The play happened on second down (i.e., there were fewer chances to get another first). Plus, there were only 46 seconds left. With the conditions stacked up, the comparative scenarios look like opposites. Some could talk themselves into mimicking No. 18 for a play like his. Cincinnati turned that attempt into one of the plays of the season.
Put another way, our eyes and memories already grade passes on a curve. We’ve seen enough highlights (and lowlights) to spot a layup or a QB threading a needle. But let’s be honest, our knowledge has limits. We don’t watch every game. Our scale might be biased. Here’s where modeling can turn the qualitative into quantitative.

Like Expected Points Added, CPOE starts with an understanding of what to expect. Intuitively, how far a pass travels has a strong impact on the probability of a completion. But there are other factors to consider.
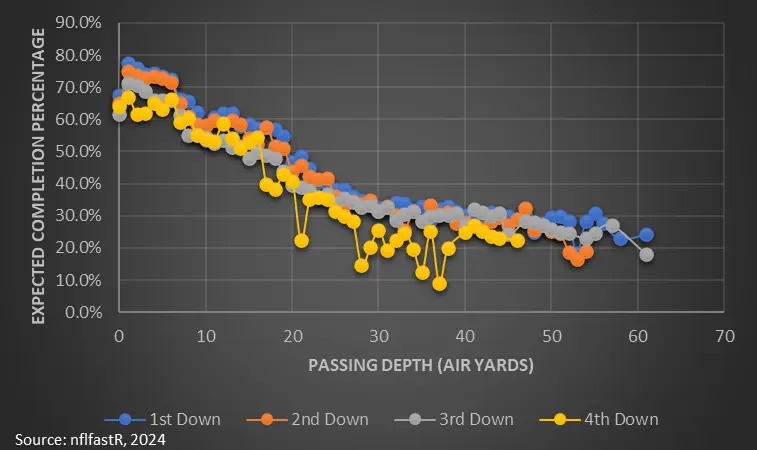
The down, distance, field position, location (yard line and pass direction), and score (among other things) all play a role. Again, this makes sense. A short pass to the middle of the field on first down at the start of the game would seem easier than a Hail Mary. OK, so we’ve got a handle on what “should” happen. I’ll re-use Higgins’s “Windmill TD” to get CPOE. Again, let’s look at the game situation.
- Cincinnati has the ball on the 21-yard line.
- It’s second down.
- The pass goes to the sideline.
Gauging the above charts, I’d estimate a 20-30-yard pass on second down to have between a 30.0% and 40.0% chance of completion. The latest expected completion model had the play at 30.5%. We can use the result to find CPOE.
- Expected Completion Percentage: 30.5%
- Result: (A Catch) 100.0% (Completion)
- Completion Percentage Over Expected: 100.0% - 30.5% = 69.5%
If Higgins had dropped the pass (first, I’d have turned the TV off), the result would have fallen to 0.0%, changing the CPOE value. Regardless, we’re back to our building-block analogy. Except here, we have completed (or incomplete) passes and expected probabilities. The difference gives us our grading curve. We can now calculate passing accuracy with their style and skill set taken into account. So, with a way to better contextualize QB play, we can gain a sense of trust in their production and the pass-catchers they support.
Why Does CPOE Matter?
Quarterback accuracy is like currency. The more they possess, the more they’re worth (at least in fantasy). Their ability to turn the mystifying into the mundane is a boost to our confidence. However, the opposite is true, too.
Aaron Rodgers’ throw almost looks like the bad version of Browning’s. Except the soon-to-be Hall of Famer only threw a yard in front of the line of scrimmage. And he sailed the throw to his best friend. Consequently, projecting his fantasy output on a weekly basis becomes more difficult.
Rodgers could chuck the ball 50 times a game (he averaged around 33 after the Davante Adams trade) if he wanted. But if only slightly better than half find their mark, we’ve got a problem. Trevor Lawrence’s 60.6% completion rate was an anchor on his ’24 campaign. Only Jalen Hurts averaged fewer passing yards per contest (204.5).
In either case, we see the (real and fantasy) need for passers to complete passes at high rates. However, by using a single stat from last year, you can start to see why using raw completion percentage becomes problematic.
Tua Tagovailoa led all QBs in completion percentage at 72.9% (min. 200 dropbacks).
The quarterback with the highest completion rate has to be one of the best at his position in fantasy, right? When healthy, only Patrick Mahomes and Joe Burrow slung it more often. If we’re getting volume and completed passes, there must be a reason Tua was 15th in FPPG. Oh, wait, I found it.
- Tagovailoa: 6.1 (aDOT)
- Mahomes: 6.9
- Burrow: 7.7
Burrow was heaving the ball downfield to dig the Bengals out of the hole their defense created. Tua took the more conservative route.
There’s no shame in it. Take what the defense gives you. However, if we want to find QBs with a higher likelihood of generating more fantasy points, we need to account for their play style along with their accuracy.

Using 2024 as a proxy, we can see the strong correlation between CPOE and passing fantasy points. In other words, we were right! A dink-and-dunk QB isn’t the same as a tight-window thrower, assuming they’re completing passes at similar rates. One needs volume, while the other picks up yards in chunks. Anyway, now let’s see how we can use CPOE to help us navigate through the season.
How Can You Use CPOE in Fantasy Football?
Ultimately, CPOE gives us a better way to assess accuracy. Moreover, passing precision lends itself to more fantasy points. A takeaway would be to prioritize passers based on their CPOE from the previous season while drafting.

At first glance, seeing guys like Burrow and Lamar Jackson toward the top jibes with what we saw on the field. Even Sam Darnold, with the seventh-highest CPOE, isn’t outlandish. But Drake Maye isn’t more accurate than Patrick Mahomes. Well, at least we don’t know for sure yet. So, we can use a single season as a snapshot but not a referendum on their full body of work. For instance, look at Burrow’s career arc.
- 2020: 2.1%
- 2021: 6.6%
- 2022: 2.7%
- 2023: 1.2%
- 2024: 6.8%
You can almost see where Burrow’s injuries caused a drop in play. He tore his ACL midway through 2020, and the calf injury hampered most of ’23.
Anyway, we could apply the same logic to any passer for a single set of games. The outcome should be a method of comparing each QB. But let’s add a layer.

I zoomed in on the QBs who had a passing aDOT below the league average in 2024 (7.9 air yards). My reasoning was two-fold. First, if a signal-caller tended to target the short area of the field AND they were inaccurate, I’d make them avoid in ’25 drafts (see Rodgers, Aaron). Second, if I could find a path to any increases in depth or accuracy, that would make them an asset in fantasy. Mahomes is an easy example.
Rashee Rice went down in Week 4. Hollywood Brown didn’t return until the playoffs. Travis Kelce was a shell of himself until the stakes were high. After seeing the bulk of Mahomes’s targets go to Xavier “I Don’t Know Where the Sideline Is” Worthy, the husk of DeAndre Hopkins, and Justin Watson, KC’s passing game should rebound with a clean bill of health by September. However, the guy right next to Mahomes on the chart caught my eye.
The rapport (or lack thereof) between Kyler Murray and Marvin Harrison was a talking point throughout Harrison’s rookie season. His on-field deployment didn’t align with a typical WR1. He had the third-highest receiving aDOT of any WR with a 20.0% target share.
Murray’s height limitations aside, incorporating Harrison on higher-percentage concepts would keep him and the offense moving downfield. It’s something both have noted as next season approaches.
Trey McBride didn’t record a receiving TD until Week 17. Harrison needed time to get on the same page as his QB. Add in more time for Murray to fully recover from his ACL injury, and we can see how his CPOE (and subsequently his fantasy output) could exceed expectations in 2025.