
What is EPA? - Defining Expected Points Added Through Scoring Plays
Chris Allen breaks down what EPA means and how we can apply it to analyzing football plays.
Medical dramas are my favorite shows.
Actually, I’ll take one step back. Any performance, big screen or TV, interlaced with a profession requiring years of training, piques my interest. Coincidentally, the plotline itself isn’t the only thing keeping me hooked. It’s the jargon.
After watching “Unstoppable” (Denzel Washington, Chris Pine, Tony Scott—enough said), I could tell the difference between a 777 train and a 1206. I’d be comfortable playing heads-up behind three stacks of high society. I’m recycling medical terms into my everyday vernacular, thanks to Noah Wyle and the rest of the crew of “The Pitt.” The way expressions buttress a universe, real or fictional, can be captivating. And, when delivered well, we don’t even need to understand them completely.

Go FantasyLife+
Your league is unique. Your advice should be too. Get personalized tools, rankings, and projections tailored to your fantasy football league settings.
Some of the stats analysts frequently toss around can be the same way. Most already know what expected points added (EPA) are when given enough context clues. It’s like if you haven’t seen/read any of the Harry Potter saga. Sure, you’ve got the books and movies somewhere around your house. It’s still not too late to join the bandwagon. Although there are enough memes out there to help you connect the dots. However, once you do dive in, you’ll see why pundits reference it so often.
The Definition of EPA
“Expected points added measure a team’s performance relative to the predicted outcome.”
Admittedly, this sounds complicated and comes with a hint of quant arrogance. It’s football! We can’t “expect” anything out there on the gridiron. Good luck with your “predicted outcomes.” But let me extend an olive branch.
Let’s break EPA down into its parts: what’s expected (the prediction) and what happened (the team’s performance). Surprisingly, setting expectations for a play isn’t as far-fetched as you’d think.
Real talk: if you had Jalen Hurts at the one-yard line behind the Eagles’ offensive line, how many points would you anticipate they’d come away with after the play was over?
Few plays have been as bankable as the Tush Push. Philadelphia got 31 cracks at plunging into the end zone last season alone (league leader). They netted 16 TDs (shocker, also league leader). But I’m not bringing up Green Bay’s most hated concept out of spite. Each team found a way to turn a goal-line stance into a score. However, turning back to my question, we can agree we’d bet on a change in the score if someone like Hurts and Co. were that deep into enemy territory.
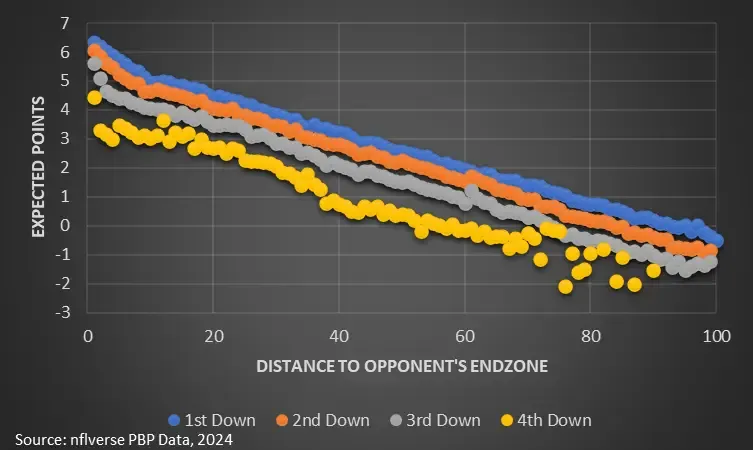
“Expected points” quantifies one of the simplest notions in football: possessing the ball closer to your opponent’s endzone is better than possessing it further away. A team’s likelihood of scoring increases as they march down the field. Except, distance isn’t the only factor to consider.
Think of each play as a chance or a life in a video game. With each fewer shot, our confidence dwindles. It doesn’t mean teams can’t make magic happen at the last minute. But, again, our expectations shouldn’t remain the same as if it were first down. Similarly, we can extend this idea to other parts of the game.
If down and distance were the only factors related to EP, we would already assume the Saints would score in this situation. They were on the one-yard line. They had at least three chances to get in the box.
However, they had blessed the Falcons 41 times. There were only a handful of seconds left in the match. The difference in score and amount of time remaining would lead most teams to go into victory formation. New Orleans did, but Jameis Winston and the guys had other plans. Anyway, through the comedy of an NFC South rivalry, we can pick out more elements affecting EP. It’s not just where the ball is, but the context of the contest. So now, with “what’s expected” laid out, let’s look at what actually happens to get EPA.
Let’s work through what we think the EP for this play would be.
- The Eagles are at the one-yard line.
- It’s first down.
- There’s plenty of time in the game (Q1, 6:17 on the clock).
Glancing at the above chart, I’d wager the play was expected to generate around 6.5 points. The tush push doesn’t always work. There’s room for error. The latest EP model had the play at 6.47. OK, maybe I looked at the spreadsheet before I guessed. In either case, the result is where we find EPA.
- Expected Points (before play): 6.47
- Expected Points (after play): 7.00
- Expected Points Added: 7.00-6.47 = 0.53
Hurts torpedoing into the Chiefs’ paint pushed their expected points to the maximum of 7.0. An extra-point attempt was all that was remaining. But, critically, the jump in EP before and after the play comes from Hurts’s (and the offensive line’s) actions. Put another way, we’ve measured the impact of the play relative to expectations. Now, with an outline of the process for calculating EPA, we can start to characterize teams based on how they operate on the field.
Why Does EPA Matter?
I used scoring plays to help define EPA for a specific reason. They make the conceptual connection easier to manage. A plunge from the goal line should (heavy emphasis on “should”) result in six points. Or, in our terms, raise the expected points of the next snap to 7.0. Touchdowns have a direct and measurable impact on the game. But, unfortunately, they’re not the norm.
We see more things happen between the 20s than outside of them. However, because they don’t result in a TD celly, it doesn’t mean they don’t matter.
Let’s look at this play from two perspectives: as (Bengals) fans and as analysts.
The fan in me still giggles (complimentary) at this throw. It’s third down, Joe Burrow has to face pressure to let the throwing line open up just enough, and he rifles the ball into Tee Higgins’ chest to convert on third down. But, ultimately, there are no points scored on the drive. It’s a nice throw, but nothing about the game changed other than the amount of time on the clock.
Now, look at it from an analyst’s POV.
- The Bengals are well within their territory.
- It’s third down.
- There are only seven minutes left in the game.
Based on this information alone, an EP of 0.46 isn’t surprising. I wouldn’t expect anything close to a touchdown in this situation. But converting the series, moving to near midfield, and earning another first down moved the Bengals to 2.29 EP on the next play. One throw was worth 1.83 EPA. That’s more than half of a field goal!
More importantly, we can get a sense of the importance of a metric like expected points added. With multiple elements of the game accounted for (down, distance, time, score), we can measure a team’s efficiency on every snap. Plus, EPA has helped dispel a myth even I bought into before diving into the data.
“Third downs are worth more than first and 10.”
On the one hand, I get it. Third downs are critical to teams staying on the field. Coordinators on both sides of the ball send out their best packages to stop a drive or keep it alive. However, from an expected points standpoint, there’s a clear distinction between which down has more value.
- 1st and 10: 2.3 (average EP across all distances)
- 3rd and 10: 1.2
Having only one chance versus three almost cuts your expectations to score in half. Yes, you can figure out how clutch your squad is or which players can handle pressure situations. But an offense’s best shot at scoring comes with more opportunities to pick up yards.
How Can You Use EPA?
Well, first, let’s review what EPA is telling us.
At a granular level, we’re measuring the significance of a single play. It doesn’t matter if it’s a 30-yard pass or an eight-yard run. The change in expected points will tell us if it was good or bad. But let’s zoom out a bit.
By the end of a game, each offense has run multiple concepts. Yes, the score will tell us which unit was more effective, but fewer points don’t necessarily equate to bad.
As I’ve often said, if I can shoehorn a replay of Cincinnati’s OT win over Denver into a piece, I’m going to do it.
Anyway, the Broncos’ 24 points were right at their season average. The Bengals barely got over their 27.8 mean for the year. But in terms of EPA, both teams played lights out.
- Cincinnati (in Week 17): 16.6 (total EPA), 5th (out of 18 games)
- Denver: 8.8, 4th
So, even with a crushing loss, we can use EPA from a single contest to see that there was still goodness within a passing game led by Bo Nix. A last-minute TD to Marvin Mims to tie the game didn’t cover up a slew of earlier mistakes. Finally, let’s take one more step back.
Quick aside: EPA per play allows us to adjust for each team’s pace. In other words, the number of attempts isn’t as important as the number of positive snaps.
Wins and losses don’t tell the whole story of a season. And as I just noted, total points or points per game won’t either. Both lack any nuance. Expected points added factors in the conditions we care about. And from a season-long standpoint, we can see which teams played ahead of their predictions. But here’s where understanding EPA can be useful.
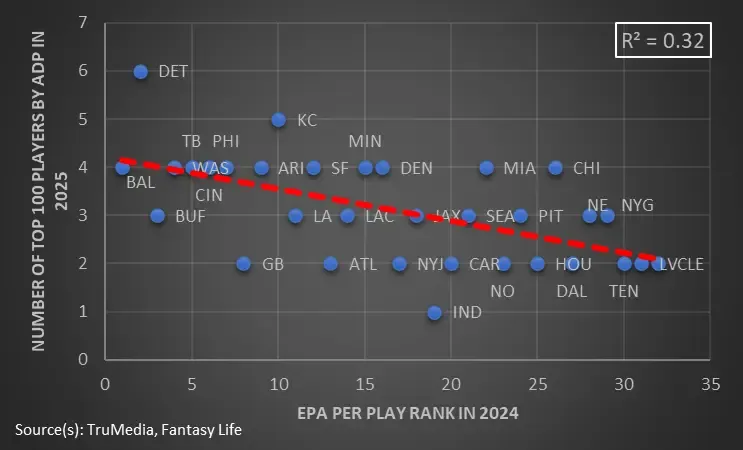
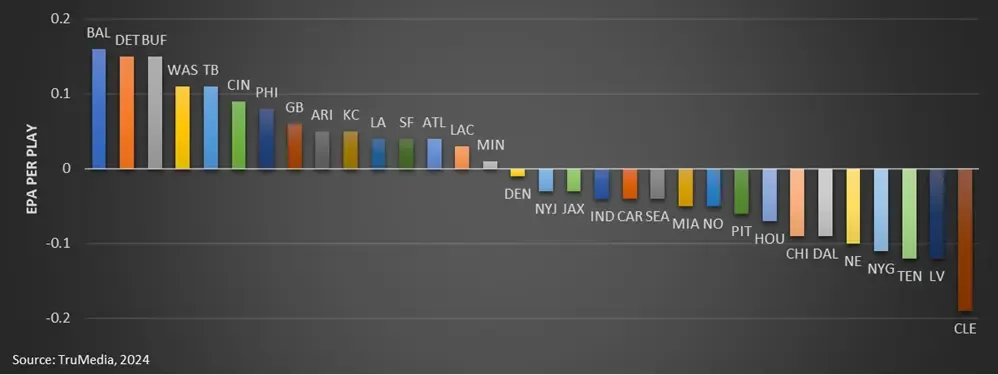
Unsurprisingly, efficiency has some hand in setting the market. We want good players. Good players come from good teams. So, being able to identify the effective offenses outside of their ability to score points can guide our roster-building process. By looking at last year’s results alone, we’ve got a first cut at the offenses we want pieces of for 2025. However, like in the case of Dallas, we can’t take all of 2024 at face value.
The Cowboys played without Dak Prescott for nine games. Jake Ferguson, their de facto WR2, effectively missed four games. CeeDee Lamb labored through a shoulder injury until Week 16. Without even getting into the ailments on the defensive side of the ball, we can see why Dallas fell to 27th in EPA per play. But as Prescott and Lamb return healthy, along with George Pickens roaming the perimeter, we can see a path to improvement.
As a result, through an understanding of EPA, we can buck the trend and get ahead of our leaguemates by investing in a team with the potential to outperform in 2025.
Go FantasyLife+
Your league is unique. Your advice should be too. Get personalized tools, rankings, and projections tailored to your fantasy football league settings.
Players Mentioned in this Article
 JalenHurtsQBPHI
- PPG
- 18.2
- Proj
- 322.0
 JameisWinstonQBNYG
- PPG
- 14.9
- Proj
- 14.7
 JoeBurrowQBCIN
- PPG
- 17.4
- Proj
- 307.9
 TeeHigginsWRCIN